
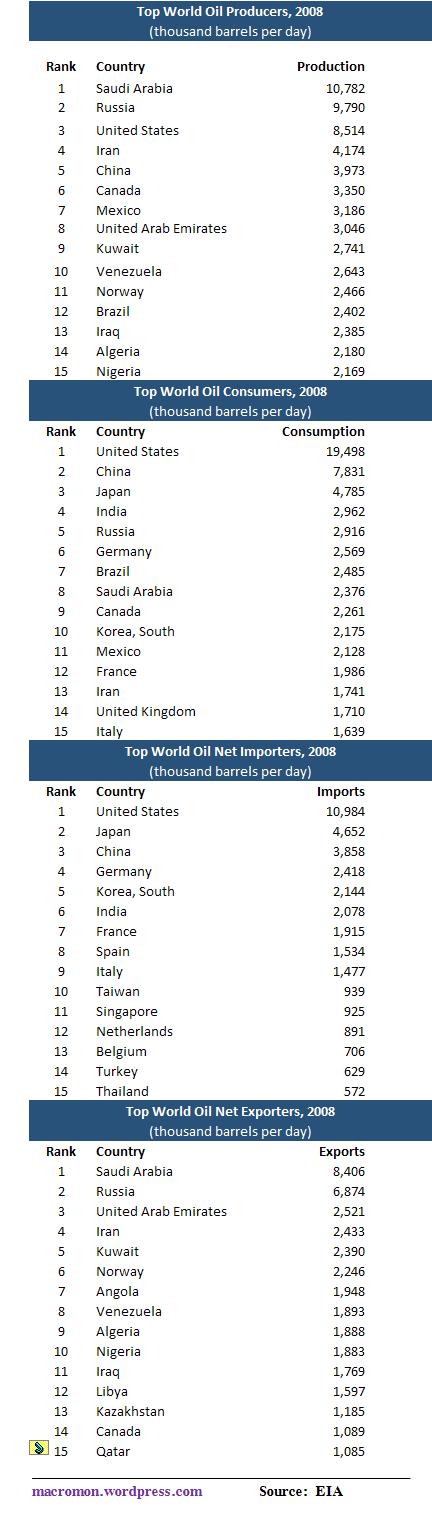
The following “Top 15 tables” from the E.I.A. provide a comprehensive geopolitical perspective of the crude oil market. You can see who is benefiting and who is taking pain from the increase in crude oil prices. The data are from 2008 but the ranks probably haven’t changed much. (click here if table is not observable)


