We anticipate monitor and comment on market-moving global economic and geopolitical issues. No dark side brooding, no wanting the world to end, no political rants. Traders, investors, policymakers, or market observers can’t afford to ignore us. In one word, perspicacity.
An educated citizenry is a vital requisite for our survival as a free people. – Thomas Jefferson
One of the most durable comforts in the AI trade has been the belief that hyperscaler capex is discretionary. If demand for chatbots and coding tools disappoints, the thinking goes, Big Tech simply turns off the taps. Bloomberg Opinion’s Chris Bryant has taken a hard look at the accounting footnotes and concluded that this optionality is largely an illusion. Credit markets, meanwhile, have stopped waiting for the equity crowd to catch up.
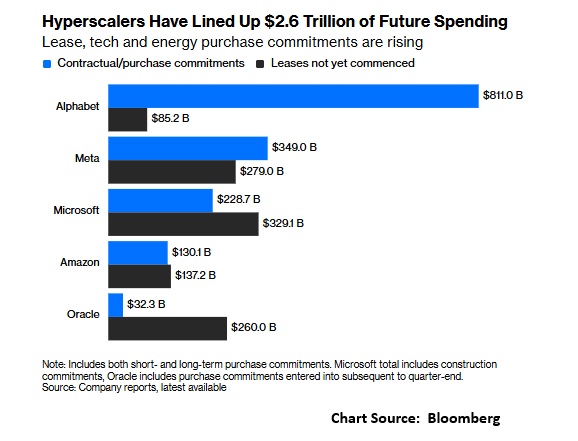
Bryant tallies the future spending commitments of the major hyperscalers at more than $2.5 trillion, counting leases not yet commenced plus contracted purchases of equipment, energy, and services. None of it appears on a balance sheet. The Q2 disclosures show how fast the lock in is building. Alphabet now carries $811 billion in purchase commitments, including $707 billion with terms beyond one year, a stunning $475 billion sequential increase. Meta’s noncancellable commitments have reached $349 billion, more than double the figure at the close of 2025, alongside $279 billion in future data center leases. Microsoft sits on $557 billion combined. Even Oracle, the smallest of the group, has $260 billion in pending leases and $19 billion of unconditional purchase commitments running five years.
What changed is the balance of power in the supply chain. On GPUs, the hyperscalers have preserved flexibility. Microsoft’s Amy Hood and Amazon’s Andy Jassy both stressed this week that chip purchases can be slowed if demand softens. But memory is a different animal. Micron has locked customers into agreements of roughly five years covering at least $100 billion of future revenue. Sandisk extracted $42 billion from just three clients. Samsung may dedicate up to 70% of capacity to customers on long contracts secured by deposits and guarantees that make exit punitive. The suppliers, scarred by past cycles, are forcing customers to carry the downturn risk. The tell is buried in Meta’s filings: nearly $11 billion of its money market cash is now restricted from general corporate use, collateralizing infrastructure purchase agreements through 2030.
Credit Risk Rising
The credit market has moved from noticing to trading. A record $127 billion of AI linked corporate bonds changed hands in July across the eight largest names, a more than fourfold rise from a year earlier, lifting the complex to 14.5% of total US investment grade volume from an average of 4.5% in 2025. Much of that paper is only months old, the residue of the bond flood that Meta, Nvidia, SpaceX, and Oracle unleashed to fund their buildouts. After initially absorbing the deluge, investors have pushed funding costs sharply higher and reached for protection.
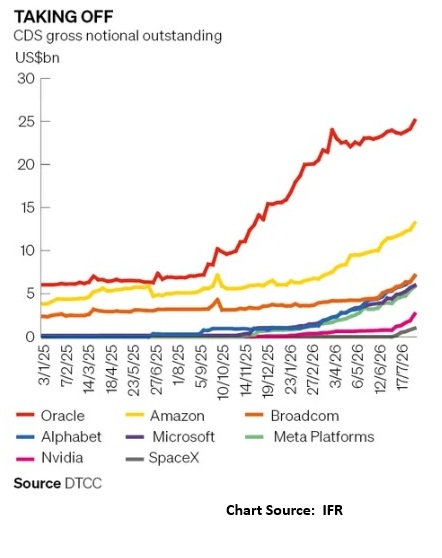
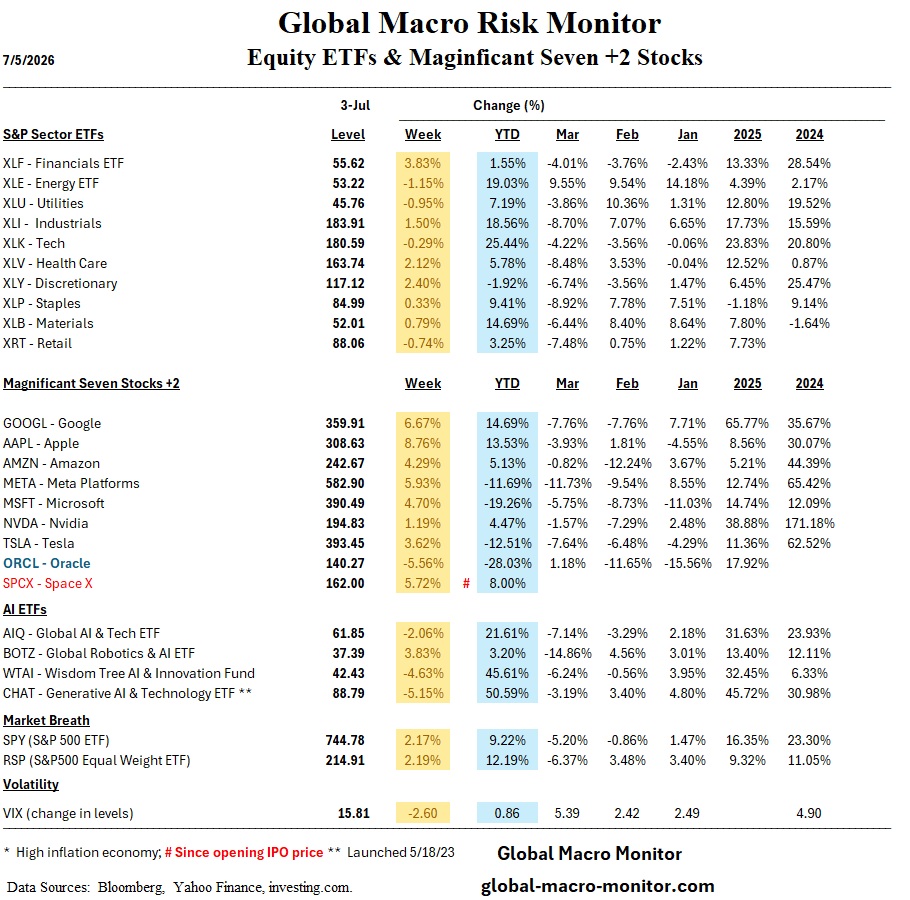
Credit default swaps (CDS) tells the story in miniature. Oracle single name notional stands at a record $25.1 billion, up from $6.9 billion a year ago, with spreads on five year protection out to 218 basis points, which is junk pricing for an investment grade name. Meta CDS, which only began trading regularly in November, has already amassed $5.8 billion notional. SpaceX hit $1 billion within weeks of its debut bond. Even the picks and shovels are getting hedged. Nvidia five year CDS touched 82 basis points this week, double its level in the middle of June, and tech now accounts for nine of the ten widest names in the CDX investment grade (IG) ndex. As S&P’s Gavan Nolan puts it, “Hyperscalers are the big driver of the investment-grade CDS market right now.”
Importantly, this is repricing, not panic. Traders report healthy flow in both directions, with protection buyers offset by investors selling CDS on the view that the selloff is overdone, and bid/offer spreads have held stable even as credit spreads widened. Hedge funds are working relative value between bonds and CDS and across the capital structure, while insurers and asset managers are returning to single name CDS for the first time in years. A functioning hedging market is a feature, not a bug. But its very emergence confirms the thesis: credit risk is now central to the hyperscaler investment case.
Step back and the macro picture is uncomfortable. Silicon Valley has abandoned its capital light DNA and converted variable spending into quasi debt, precisely as its funding shifted from internal cash flow to public bond markets. If cheaper open source models undercut OpenAI and Anthropic, the contracted revenue backing these pledges erodes, but the pledges remain. That is negative convexity at the heart of the market’s largest concentration of equity value. The capex put is smaller than advertised, the exit doors are narrowing, and the CDS market is now quoting the cover charge.
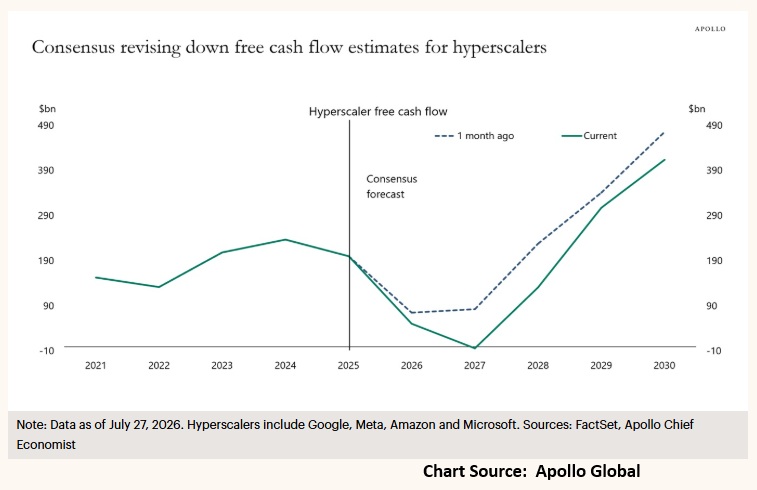
Markets are getting antsy for a return on all this invested capital, and the pressure is slowly building.
One of the most durable comforts in the AI trade has been the belief that hyperscaler capex is discretionary. If demand for chatbots and coding tools disappoints, the thinking goes, Big Tech simply turns off the taps. Bloomberg Opinion’s Chris Bryant has taken a hard look at the accounting footnotes and concluded that this optionality is largely an illusion. Credit markets, meanwhile, have stopped waiting for the equity crowd to catch up.
Bryant tallies the future spending commitments of the major hyperscalers at more than $2.5 trillion, counting leases not yet commenced plus contracted purchases of equipment, energy, and services. None of it appears on a balance sheet. The Q2 disclosures show how fast the lock in is building. Alphabet now carries $811 billion in purchase commitments, including $707 billion with terms beyond one year, a stunning $475 billion sequential increase. Meta’s noncancellable commitments have reached $349 billion, more than double the figure at the close of 2025, alongside $279 billion in future data center leases. Microsoft sits on $557 billion combined. Even Oracle, the smallest of the group, has $260 billion in pending leases and $19 billion of unconditional purchase commitments running five years.
What changed is the balance of power in the supply chain. On GPUs, the hyperscalers have preserved flexibility. Microsoft’s Amy Hood and Amazon’s Andy Jassy both stressed this week that chip purchases can be slowed if demand softens. But memory is a different animal. Micron has locked customers into agreements of roughly five years covering at least $100 billion of future revenue. Sandisk extracted $42 billion from just three clients. Samsung may dedicate up to 70% of capacity to customers on long contracts secured by deposits and guarantees that make exit punitive. The suppliers, scarred by past cycles, are forcing customers to carry the downturn risk. The tell is buried in Meta’s filings: nearly $11 billion of its money market cash is now restricted from general corporate use, collateralizing infrastructure purchase agreements through 2030.
Credit Risk Rising
The credit market has moved from noticing to trading. A record $127 billion of AI linked corporate bonds changed hands in July across the eight largest names, a more than fourfold rise from a year earlier, lifting the complex to 14.5% of total US investment grade volume from an average of 4.5% in 2025. Much of that paper is only months old, the residue of the bond flood that Meta, Nvidia, SpaceX, and Oracle unleashed to fund their buildouts. After initially absorbing the deluge, investors have pushed funding costs sharply higher and reached for protection.
Credit default swaps (CDS) tells the story in miniature. Oracle single name notional stands at a record $25.1 billion, up from $6.9 billion a year ago, with spreads on five year protection out to 218 basis points, which is junk pricing for an investment grade name. Meta CDS, which only began trading regularly in November, has already amassed $5.8 billion notional. SpaceX hit $1 billion within weeks of its debut bond. Even the picks and shovels are getting hedged. Nvidia five year CDS touched 82 basis points this week, double its level in the middle of June, and tech now accounts for nine of the ten widest names in the CDX investment grade (IG) ndex. As S&P’s Gavan Nolan puts it, “Hyperscalers are the big driver of the investment-grade CDS market right now.”
Importantly, this is repricing, not panic. Traders report healthy flow in both directions, with protection buyers offset by investors selling CDS on the view that the selloff is overdone, and bid/offer spreads have held stable even as credit spreads widened. Hedge funds are working relative value between bonds and CDS and across the capital structure, while insurers and asset managers are returning to single name CDS for the first time in years. A functioning hedging market is a feature, not a bug. But its very emergence confirms the thesis: credit risk is now central to the hyperscaler investment case.
Step back and the macro picture is uncomfortable. Silicon Valley has abandoned its capital light DNA and converted variable spending into quasi debt, precisely as its funding shifted from internal cash flow to public bond markets. If cheaper open source models undercut OpenAI and Anthropic, the contracted revenue backing these pledges erodes, but the pledges remain. That is negative convexity at the heart of the market’s largest concentration of equity value. The capex put is smaller than advertised, the exit doors are narrowing, and the CDS market is now quoting the cover charge.
Markets are getting antsy for a return on all this invested capital, and the pressure is slowly building.
Ceasefire Off, Risk Still On: Positioning Into a Loaded Week
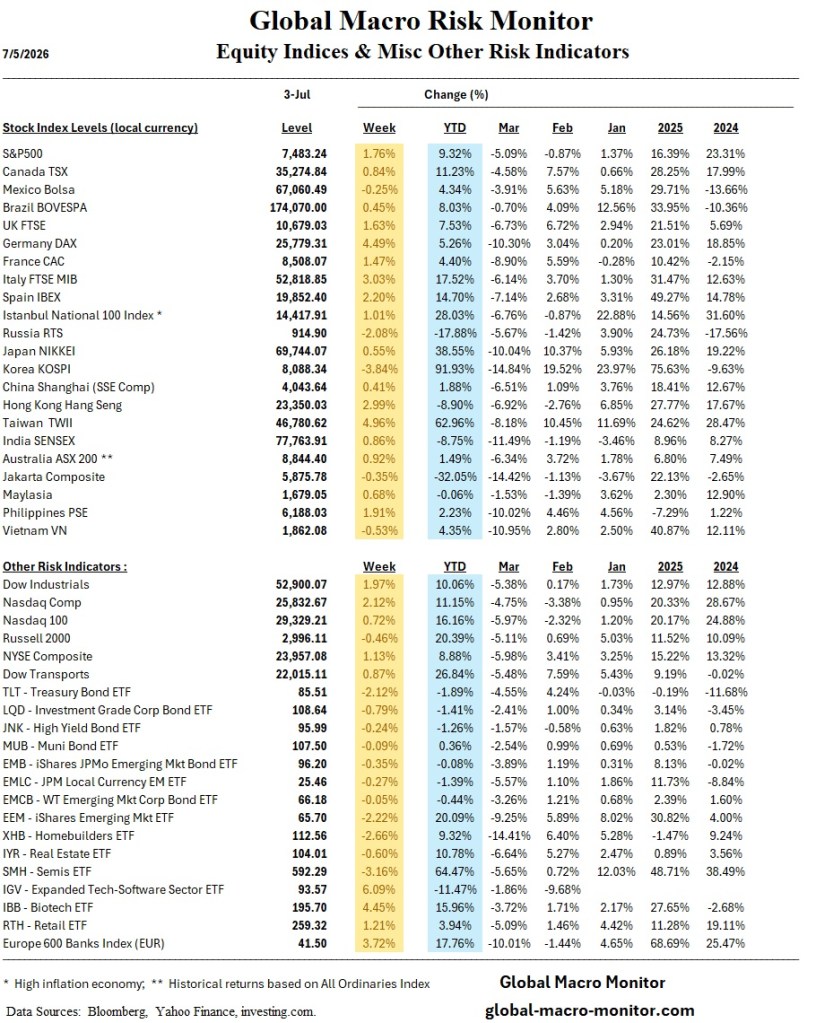
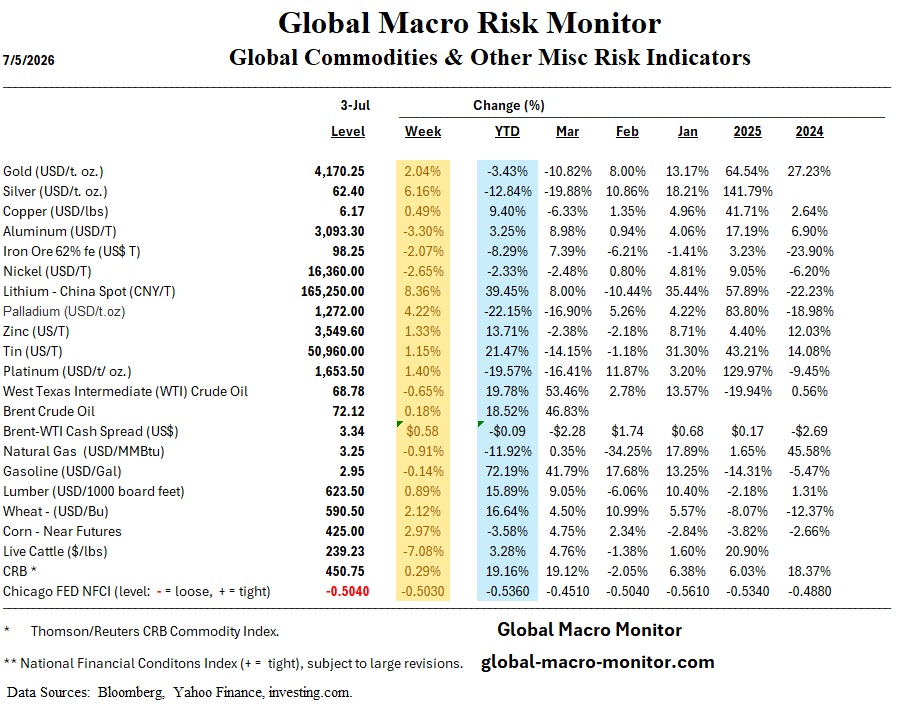
The market’s message last week was unambiguous: geopolitical tail risk gets sold, not bought. Trump declared the US-Iran ceasefire over, both sides exchanged attacks in the Strait of Hormuz, the VIX kissed 19 Wednesday — and the S&P 500 still closed the week up 1.23% at a three-week high, with VIX back to 15.25. As long as WTI stays subdued near $71.41, flows will keep chasing the economy and earnings, not Tehran.
Rates Are the Real Story
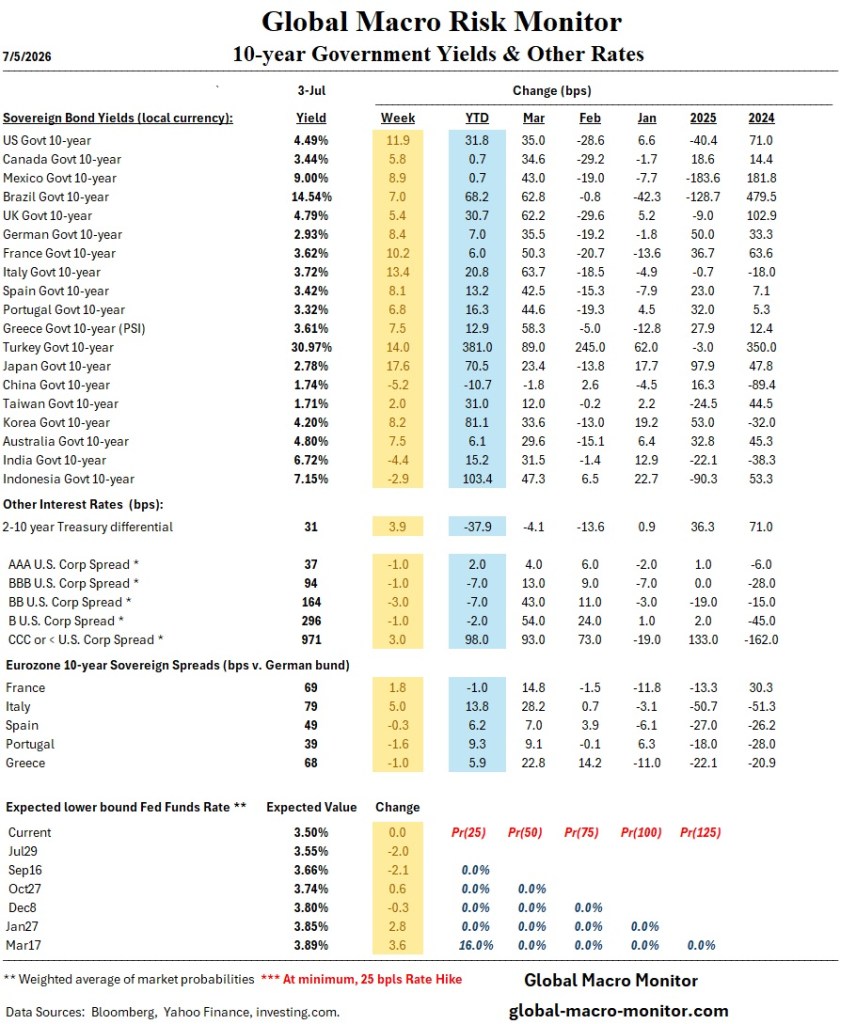
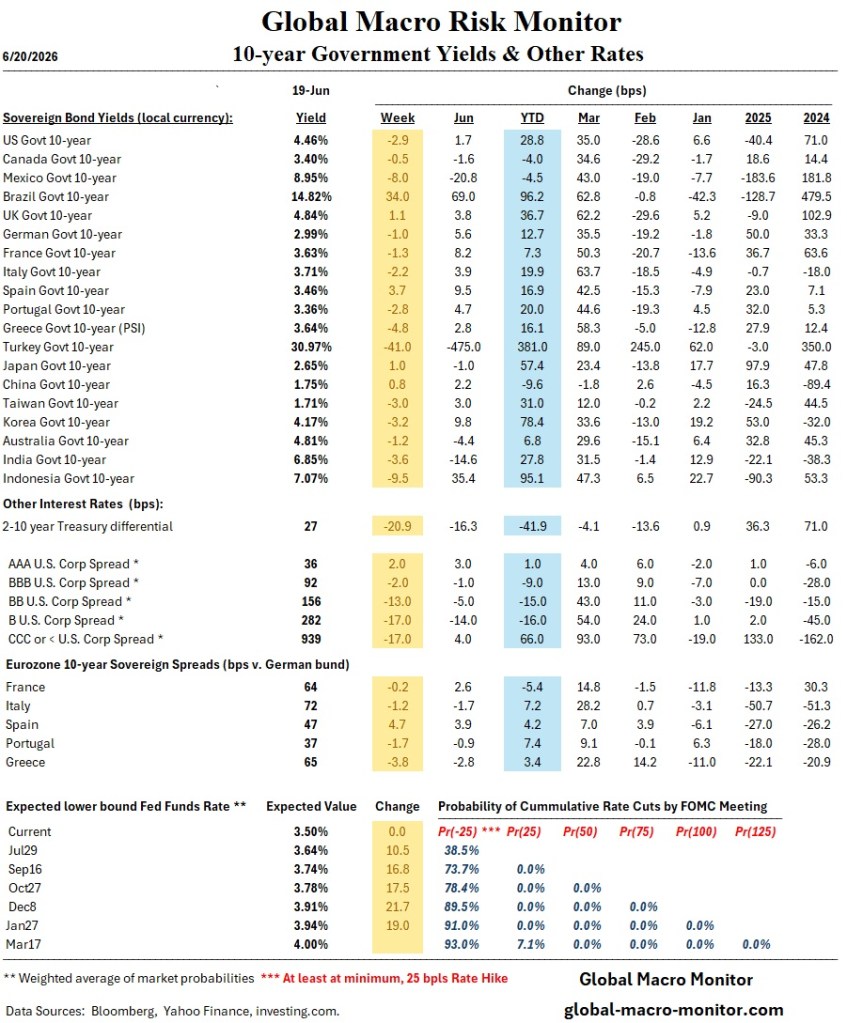
The bond market isn’t as sanguine. Yields rose ~7-8 bps across the curve (2Y 4.20%, 10Y 4.56%, 30Y above 5%), and hike probabilities repriced sharply: July FOMC odds jumped to 31% from 17%, September to 84% from 61%. The June minutes showed a committee split between holding and hiking, with near-unanimity that persistent inflation forces a move. Warsh’s first semiannual testimony Tuesday at 10:00 a.m. ET — hours after June CPI — is the week’s binary event. A hot print plus a hawkish chair leaves little cushion in duration.
Technicals: Constructive, With One Caveat
The SPX Equal Weight bounced firmly off its 20-day SMA — textbook uptrend behavior pointing toward new highs. Breadth confirms: 65.3% of SPX members above their 200-day, a four-month high. The caveat is semis. The SOX reclaimed its 50-day SMA after Tuesday’s 4% drop, but the price action is choppy rather than a clean V-bounce. If chips fail here, expect rotation rather than breakdown — but watch confidence.
The Week Ahead
Q2 earnings kick off with FactSet forecasting 23.3% YoY S&P 500 growth. Banks report Tuesday-Wednesday (JPM, GS, BAC, C, WFC, MS, BLK); ASML Wednesday and TSMC Thursday will stress-test the semi rebound. PPI, retail sales, and housing data round out the docket. Crypto desks should also mark August 7: Bitcoin’s BIP 110 soft-fork signaling window opens with only a 55% miner threshold — a governance dispute, but a potential volatility source.
Forecast: Slightly Bullish, with Higher Volatility. The risks to that call: an oil spike, or a hawkish Warsh pushing yields through the equity market’s pain threshold.
God help us. The godless Commies are on the march!
New York City has adopted a new rule that bans companies from using deceptive subscriptions to trap customers into paying for gym memberships, streaming services and other recurring charges, the city’s consumer protection office said.
The new rule, which will start on 1 October, promises hefty fines and aggressive enforcement for violators. Companies that do not provide a simple way to cancel could pay $525 per user subscription, back fees and additional fines. – The Guardian
This graphic ranks the world’s most valuable unicorn companies — private firms commanding valuations of $1 billion or more, without ever answering to public markets.
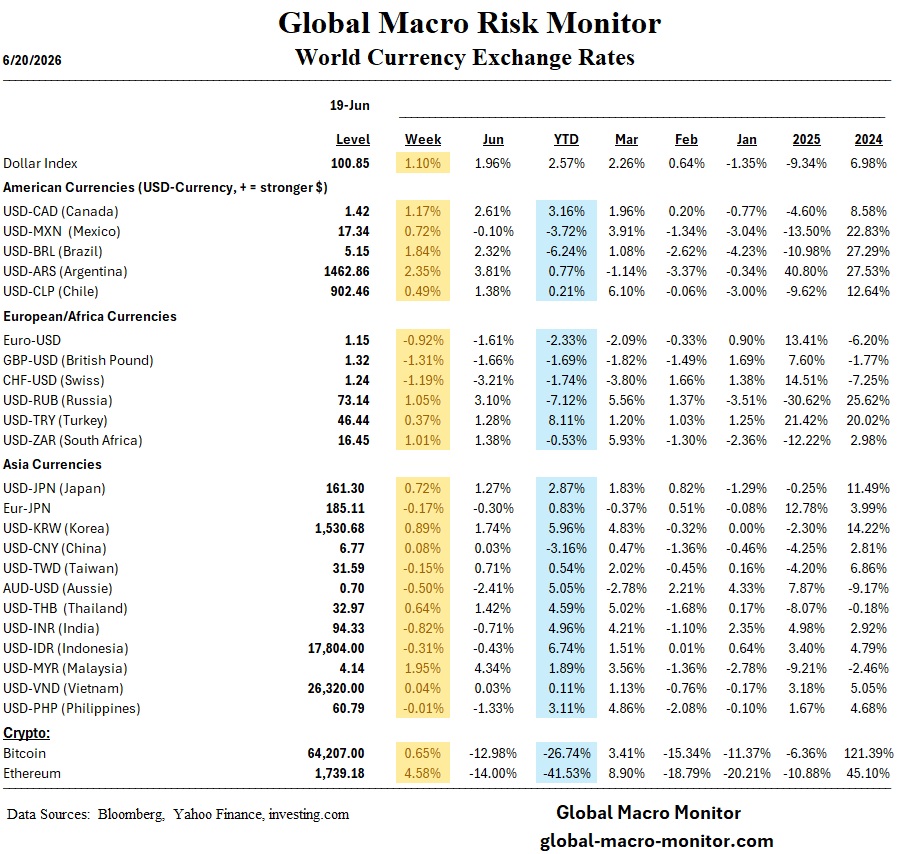
Markets Navigate a Hawkish Fed Surprise as Asia Surges on AI Wave
Week Ending June 19, 2026
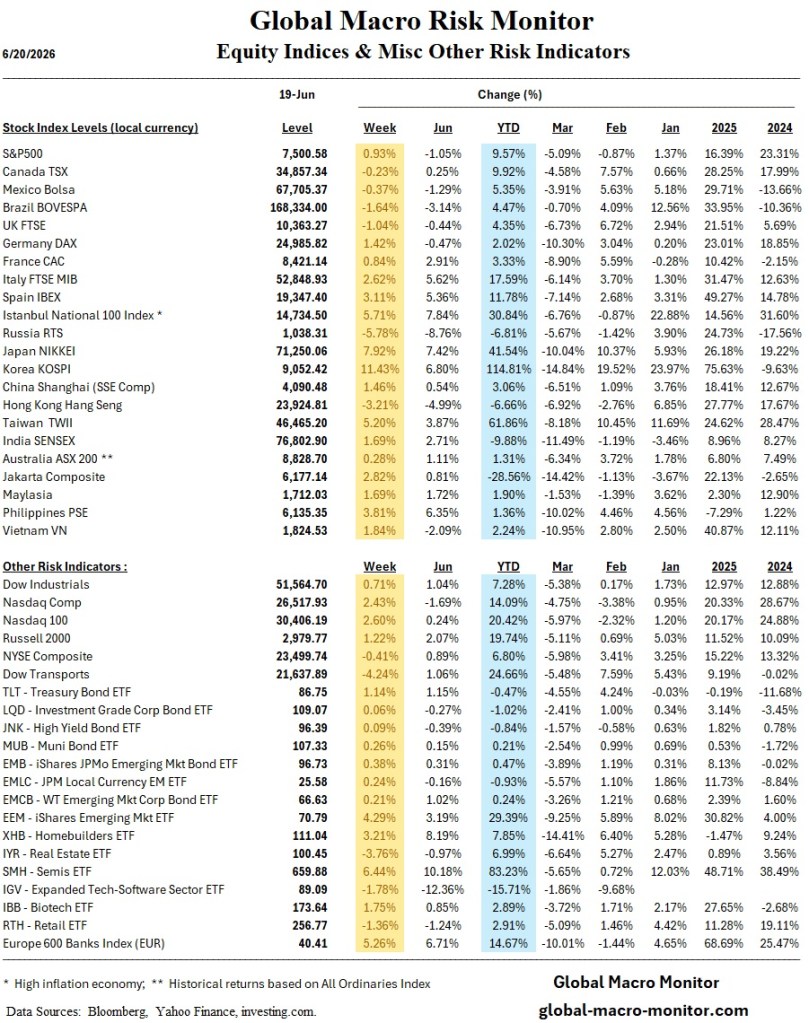
Markets delivered a split verdict this week — a resurgent Asia riding the AI/semiconductor wave higher, while Wall Street grappled with a Fed that just reminded investors it still has a trigger finger.
The Fed Drops the Hawk
The week’s defining event was Kevin Warsh’s first FOMC meeting as Fed Chair, and he wasted no time establishing his credentials as an inflation hawk. Rates were held steady at 3.50–3.75%, but that was the last dovish thing about Wednesday afternoon. The updated dot plot was a gut-punch: nine of 18 officials penciled in at least one rate hike in 2026, with six projecting two or more. Warsh declared price stability the committee’s “North Star” — strong, unanimous, and unambiguous. Translation: the Fed’s easing narrative is dead.
The market reaction was swift. The 2-year Treasury yield spiked 15 basis points, briefly touching a 52-week high of 4.21%. The S&P 500 shed roughly 1.4% and the Nasdaq dropped 1.5% on Wednesday, though dip buyers salvaged the week by Thursday’s close.
The rate market is now doing the math. The probability of a July hike has jumped to 40%, and markets are pricing a 90% chance of at least one hike by December. This is a seismic shift from just two weeks ago, when a 2027 rate hike felt like a stretch.
Warsh also buried forward guidance — he stated it’s no longer suited to the current policy environment. Buckle up. Every data release now matters.
Asia Rips; Semiconductors Lead the Charge
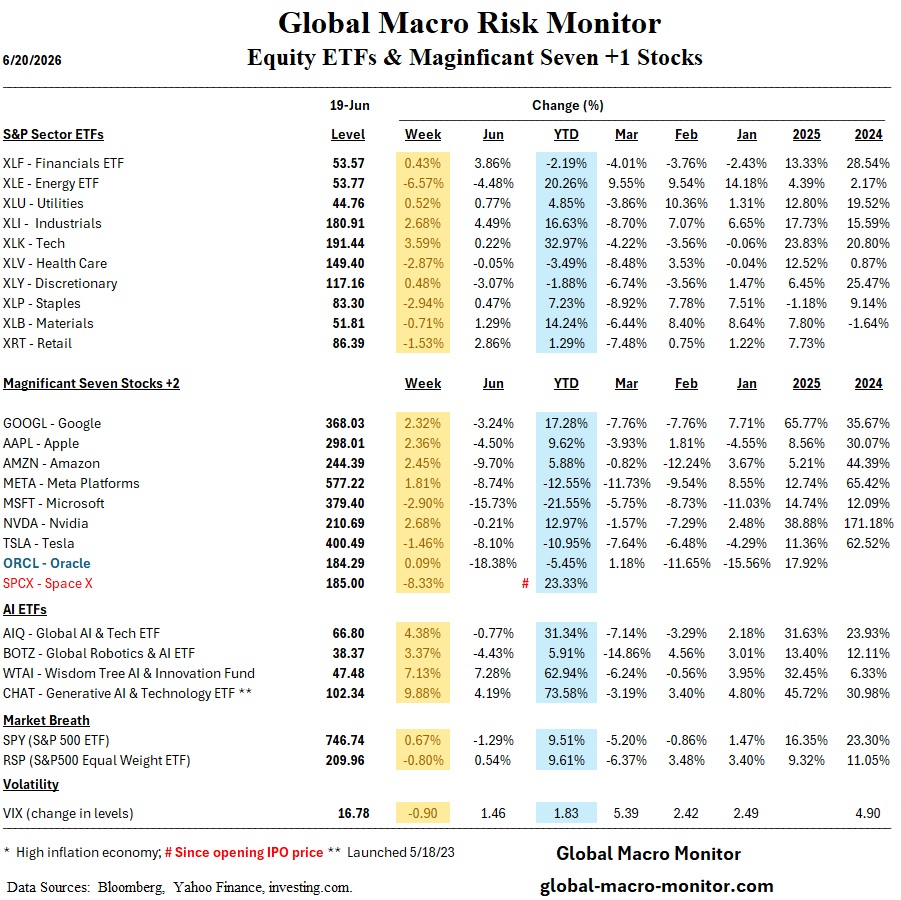
While Washington rattled nerves, Asia was ripping. Japan’s Nikkei surged 7.6% on the week, hitting fresh all-time highs, with semiconductor equipment and AI-linked tech stocks leading the charge. Korea exploded over 11%, powered by the global semiconductor rally. The PHLX Semiconductor Index (SOX) also notched fresh all-time highs stateside, and AI names broadly outperformed. The AI infrastructure buildout theme remains firmly in its expansionary phase — compute demand still outstrips supply, and the market is rewarding that scarcity aggressively.
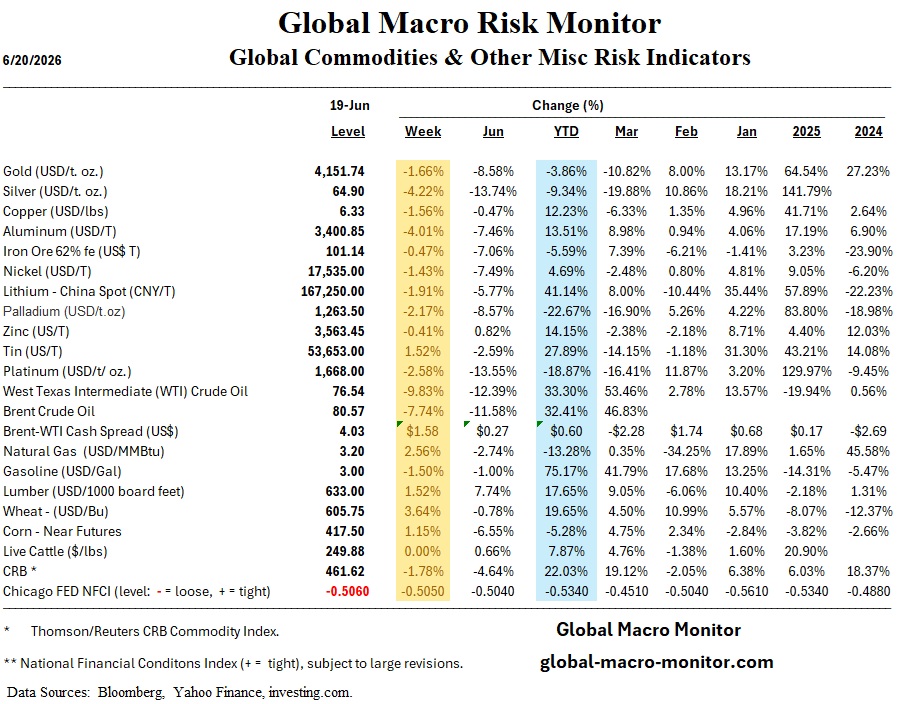
Geopolitics Provides a Tailwind
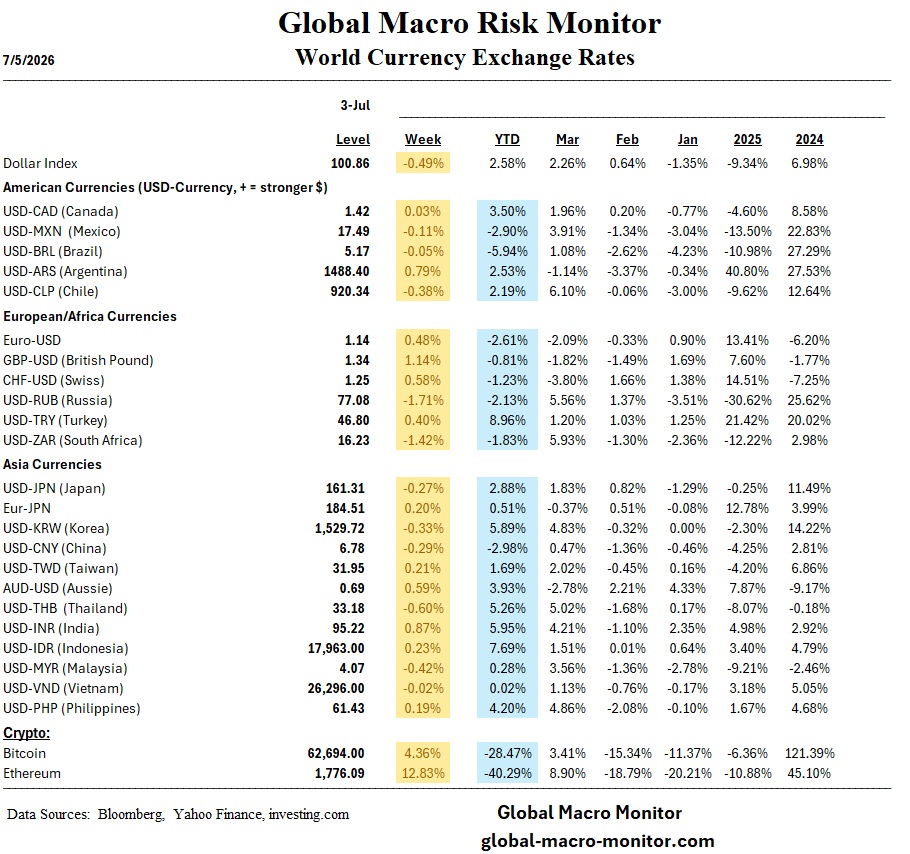
A U.S.-Iran memorandum of understanding, clearing a path to reopen the Strait of Hormuz, sparked a sharp Monday rally and sent oil prices tumbling toward $75/barrel — down nearly 40% from conflict peaks. Lower energy prices provided some inflation relief, though the hawkish Fed quickly overshadowed that narrative.
The Bottom Line
The bull market’s two pillars — 20%-plus earnings growth and AI infrastructure spending — remain intact. But the Fed has drawn a line. With rate hike odds surging and Warsh signaling data-dependency without a policy roadmap, volatility is the price of admission going forward. Asia’s momentum is real, AI is real — but so is the Fed.
Watch the PCE report Thursday and Micron’s earnings next Wednesday. Both could move markets significantly.

 We anticipate monitor and comment on market-moving global economic and geopolitical issues. No dark side brooding, no wanting the world to end, no political rants. Traders, investors, policymakers, or market observers can’t afford to ignore us. In one word, perspicacity.