
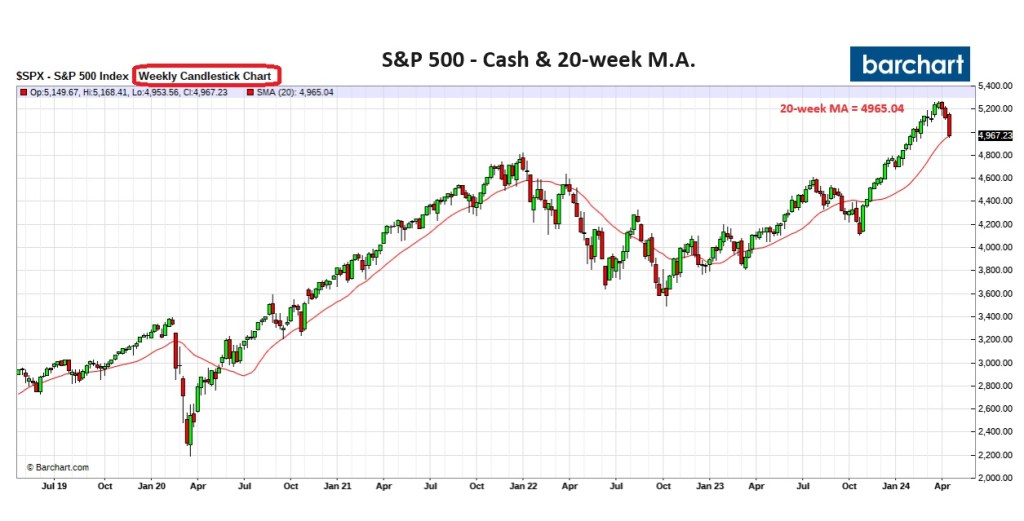
The S&P 500 closed precisely at its 20-week moving average following six consecutive days of declines. It is noteworthy that the index briefly dipped below its 20-week moving average during after-hours trading early on Friday, but rebounded as the Israeli-Iranian conflict began to de-escalate.
Such prolonged downturns, spanning six or more days, are relatively rare. They have occurred in just 1 percent of the 18,725 trading days since January 1950 and less than 0.5 percent of days since January 2000. The record streak for consecutive down days for the S&P500 is 14, which has occurred twice, in August 1975 and August 1982.
Historically, if the S&P 500 is poised for a rebound, it typically occurs around this point. The table below presents the forward returns following a negative streak of six consecutive days or more.
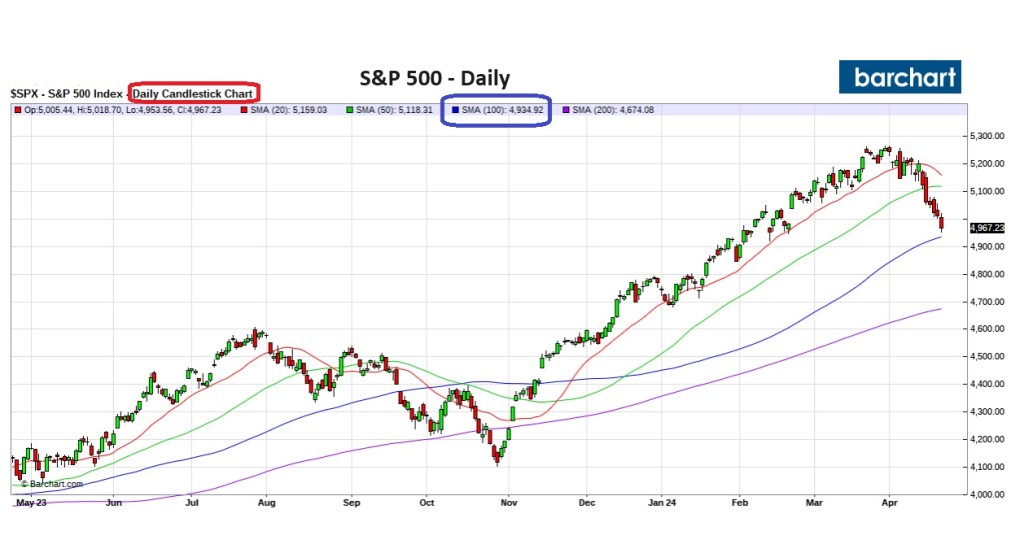
We do think, or our calculated guess is that the S&P 500 is likely to trend towards its 200-day moving average, currently at approximately 4674, which represents a decline of about 6 percent from last Friday’s close.
Stay frosty, folks.


Pingback: The Dow(maggio) Jones Hitting Streak | Global Macro Monitor