Classic stock market wealth effect. I’d bet the family jewels that if the S&P 500 was, say at 5,000, ticket prices would be one third of these prices. I am conflicted. Big Knicks fan during my Wall Street days during the Patrick Ewing era, but they broke my heart. I love Wemby, however.
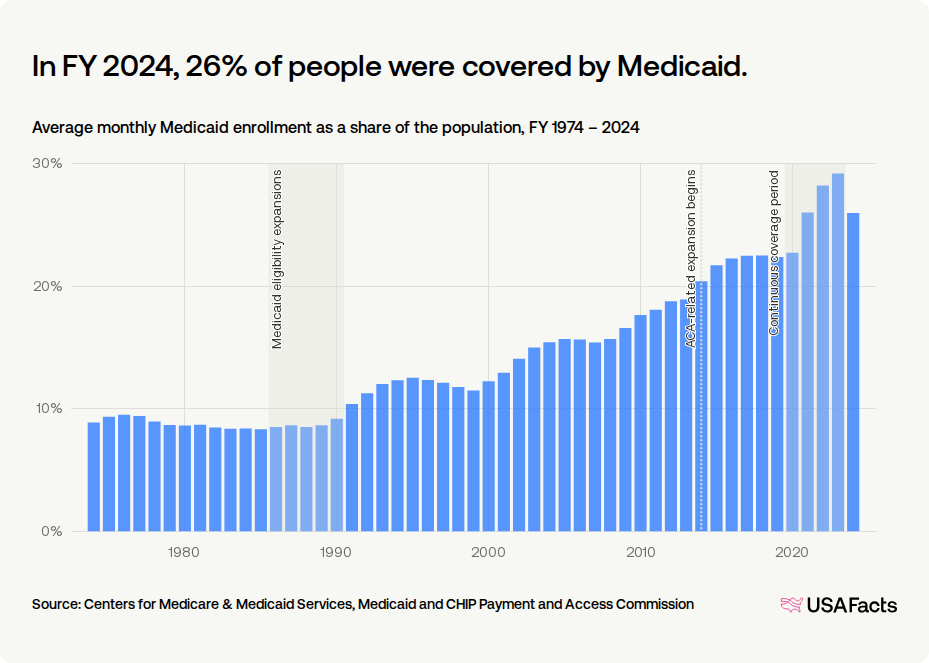
Record Enrollment: Medicaid peaked at 26% of the U.S. population (88.2 million people) in FY 2024, cementing its status as the nation’s largest insurer.
Decoupling Welfare: Structural growth began when late 1980s mandates disconnected healthcare eligibility from cash public assistance programs.
Income Standard: The ACA replaced demographic restrictions with a standardized, income-based limit up to 138% FPL.
Welcome-Mat Effect: Simplified enrollment processes prompted millions of previously eligible but unenrolled individuals to sign up.
Continuous Enrollment: The 2020 FFCRA barred states from disenrolling anyone during the pandemic, stabilizing national coverage.
Procedural Unwinding: The post-pandemic “unwinding” stripped coverage from 20.7 million people, though 68.7% of these were due to procedural paperwork errors.
The OBBBA Shock: The newly enacted One Big Beautiful Bill Act of 2025 represents the largest-ever cut to basic needs programs, slashing over $1 trillion in federal healthcare spending and leading to over 10 million more uninsured Americans.
Mandatory Work Requirements: Starting in 2027, able-bodied adults in the expansion population must meet an 80-hour monthly work or community service mandate, which is expected to disenroll over 5 million people.
Administrative Barriers: The OBBBA doubles the frequency of eligibility redeterminations to every six months for the expansion population, threatening to disenroll an additional 700,000 people due to paperwork.
State Funding Restrictions: Capping provider taxes from 6% to 3.5% under the new law severely restricts state fiscal capacity, creating deep budgetary pressures.
Our analysis in our recent post, “America’s Fiscal Mirage: Tariff Sugar Rush, Structural Hangover,” highlights that while recent deficit figures may appear to show a very slight improvement, they mask a deeper, persistent fiscal fragility driven by structural imbalances rather than sustainable reform. Despite temporary boosts from tariff revenue, many of which are now under threat from recent legal reversals, the long-term outlook remains grim, as mandatory spending continues to operate largely on autopilot. Central to this challenge is the sheer scale of entitlement costs; for instance, Medicaid spending alone now accounts for approximately 15 percent of total U.S. government outlays, creating a rigid spending floor that complicates any meaningful attempt to curb the nation’s mounting debt trajectory.
The structural landscape of American healthcare has undergone a seismic shift. As highlighted in the historical data, a monthly average of 26% of the U.S. population was covered by Medicaid in fiscal year (FY) 2024. For a program created in 1965 to act as a highly restrictive safety net tied strictly to cash welfare , this represents a fundamental social and fiscal transformation.
As an economist analyzing this trajectory, it is clear that this dramatic enrollment surge was driven by compounding policy waves visible in the historical trends:
1. Welfare Decoupling (The 1980s & 90s Spikes)
Originally, Medicaid required enrollees to receive cash welfare assistance. Congressional mandates during the “Medicaid eligibility expansions” of the late 1980s and early 1990s decoupled these requirements, expanding eligibility to low-income pregnant women and children regardless of welfare status. This separation was finalized by the 1996 welfare reform and the 1997 launch of the Children’s Health Insurance Program (CHIP).
2. The ACA’s Standardized Eligibility (2014)
The Affordable Care Act of 2010 fundamentally modernized Medicaid by establishing a standardized, income-based model. In the states that adopted expansion, coverage opened to all nonelderly adults earning up to 138% of the Federal Poverty Level (FPL). This was incentivized by a permanent 90% federal matching rate (FMAP) and triggered a massive “welcome-mat” or “woodwork” effect, enrolling millions of previously eligible but unenrolled individuals.
3. Pandemic Continuous Coverage (2020–2023 Peak)
The most dramatic enrollment acceleration occurred during the COVID-19 pandemic. Under the Families First Coronavirus Response Act (FFCRA) of 2020, states received enhanced FMAP funding in exchange for keeping enrollees continuously covered. By halting annual administrative eligibility checks, this policy eliminated enrollment “churn,” sending rolls to a peak of 94 million by early 2023.
4. The Great Unwinding (Post-Pandemic Correction)
Following the end of the pandemic continuous coverage mandate, states began the massive “unwinding” process, conducting redeterminations that resulted in over 20 million disenrollments—moderating FY 2024 coverage back to 26%. Many individuals were disenrolled for “procedural” reasons—such as failing to return renewal paperwork—rather than for a true loss of financial eligibility.
5. The “Big, Beautiful Bill” and the Retrenchment Era
The historical upward trajectory of Medicaid coverage shown in the chart—where enrollment expanded from a modest 8% in the 1970s to a peak of 26% of the population in FY 2024 —is poised for an unprecedented reversal. On July 4, 2025, the budget reconciliation package colloquially known as the “One Big, Beautiful Bill Act” (OBBBA) was signed into law, enacting the largest-ever cuts to basic needs programs in U.S. history. To fund tax cuts, the legislation is projected to slash federal healthcare spending by over $1 trillion, including $911 billion in direct Medicaid cuts, resulting in an estimated 10 million fewer insured Americans over the next decade.
The single largest driver of this projected contraction is the nationwide implementation of mandatory work and community engagement requirements starting January 1, 2027. Under the OBBBA, non-disabled adults in the ACA expansion group (ages 19-64) must document at least 80 hours of work, community service, or education per month to maintain their coverage. The Congressional Budget Office (CBO) estimates this provision alone will reduce federal outlays by $326 billion over ten years, causing upwards of 5 million people to lose coverage. Furthermore, the law doubles the frequency of administrative checks, forcing these expansion enrollees to undergo eligibility redeterminations every six months rather than annually. This increased paperwork burden is expected to strip coverage from an additional 700,000 eligible individuals. Coupled with a reduction in the Medicaid provider tax cap from 6% to 3.5%—which severely restricts state funding capacity—this law signals a dramatic, policy-driven retrenchment that will sharply bend the historical enrollment curve downward.
Sources:
USAFacts: Monthly Average Medicaid Enrollment & Population Share.
Kaiser Family Foundation (KFF): Health Policy 101, Unwinding Tracking, and Reform Overviews.
Medicaid and CHIP Payment and Access Commission (MACPAC): MACStats & Unwinding Data Brief.
National Bureau of Economic Research (NBER): Research Papers on ACA Medicaid Expansions & Fiscal Federalism.
American Medical Association (AMA): Briefings on the One Big Beautiful Bill Act.
GoodRx & RAND Corporation: Impact analysis of the One Big Beautiful Bill Act.
Every year, I share this video of French caretakers who take sand from Omaha Beach in Normandy, and scrub them into the letters to give them the gold coloring.
At 100 years old, WWII veteran Bernie Smoot still drives his convertible Ford Mustang to play golf five days a week, shoots in the low 80s and shares wisdom from 74 years in the game: “You live to play golf. But to reach my age, you play golf to live.”
We are reposting the Appendix added and updated to yesterday’s post, America’s Fiscal Mirage: Tariff Sugar Rush, Structural Hangover. We thought it important as President Trump has formally requested a historic $1.5 trillion national defense budget for Fiscal Year 2027. This represents a massive 44% increase over the current year’s base funding levels, marking the largest year-over-year military spending hike in post-World War II history. There is no doubt the markets will balk at deficit financing this without much higher interest rates, thus more pressure coming to cut spending on Medicare/Medicaid and Social Security programs. The “crowding out” chickens are finally coming home to roost.
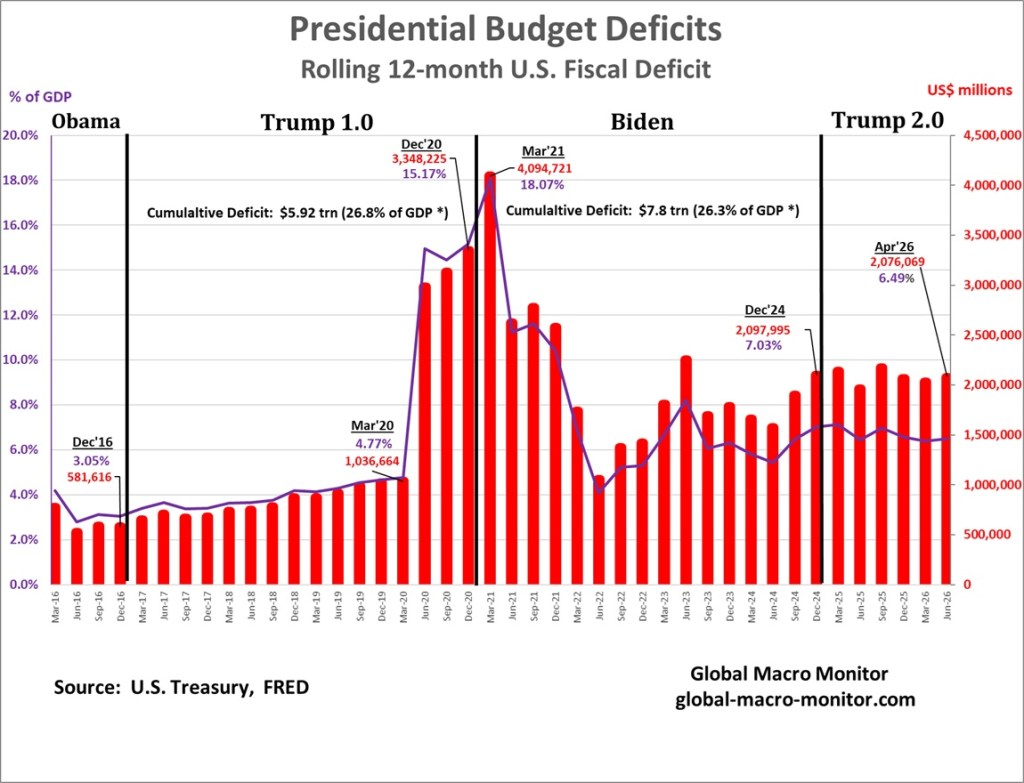
The conventional political narrative holds that Biden blew up the federal deficit. The data tell a more complicated story, and one that will surprise many.
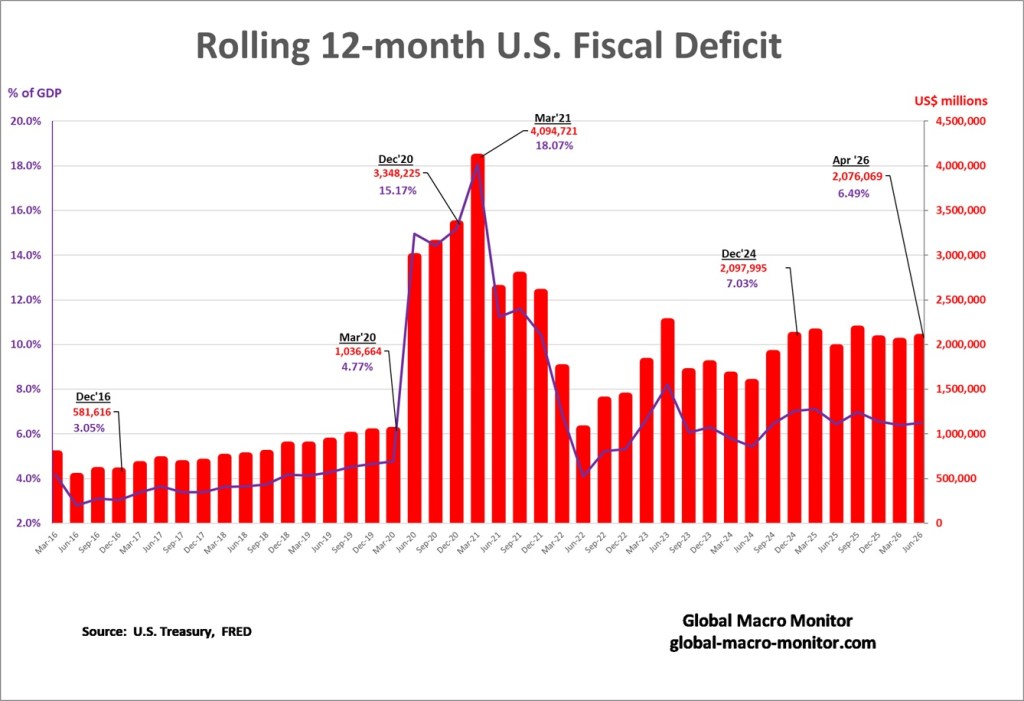
Presdient Obama left office with the rolling 12-month deficit at a relatively disciplined 3% of GDP. Trump 1.0 then widened the structural deficit to nearly 5% of GDP by March 2020, before the COVID pandemic began to spread in the United States. The pandemic did the rest: emergency spending exploded the deficit to 15.2% of GDP by December 2020. What is rarely acknowledged is that Trump handed Biden a deficit already running at 15% of GDP — among the largest in U.S. peacetime history. Biden’s early months pushed it marginally higher to a peak of 18.1% by March 2021, but the trajectory was largely baked in before the inauguration.
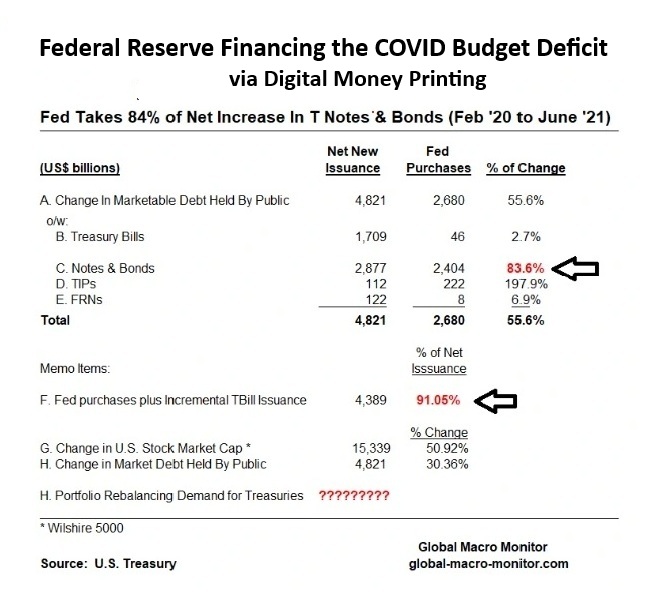
The fiscal shock was too large for private bond markets to absorb. The Fed stepped in as the bond and U.S. Treasury debt buyer of last resort, purchasing 83.6% of all net new Treasury notes and bonds issued between February 2020 and June 2021 — funding 91% of net issuance when incremental T-bills are included. That is digital money-printing at scale, and it is the true origin story of post-COVID inflation in both financial assets and goods and services.
(Source: U.S. Treasury, FRED, Global Macro Monitor. Full fiscal scorecard: global-macro-monitor.com)
In his first term, President Trump was constrained.
This term, he has surrounded himself with people whose chief qualification is fealty. The result is reckless policy and the brazen pursuit of enrichment.
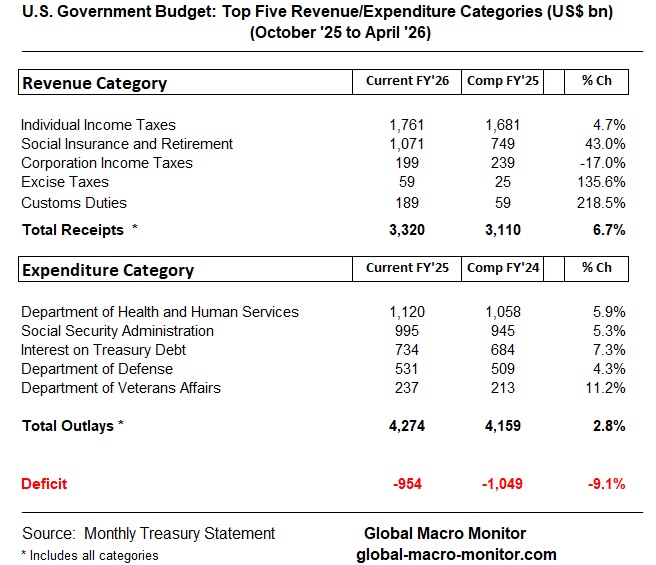
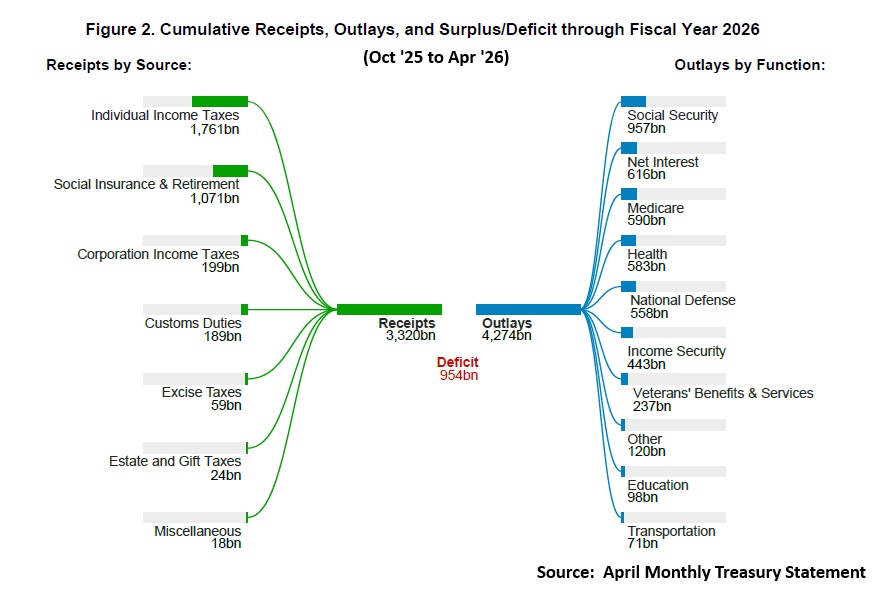
The headlines look almost encouraging. The U.S. federal deficit for the first seven months of fiscal year 2026 came in at $955 billion — $94 billion better than the same period a year earlier. Revenues rose 7%, outlays only 3%. So is Washington finally getting its fiscal house in order?
Not quite. Dig one layer deeper and the picture is less a turnaround than a temporary optical illusion.
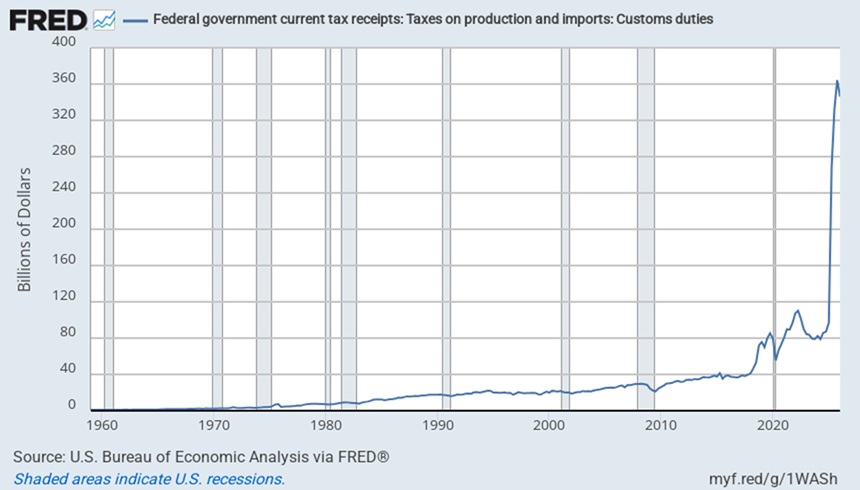
The Tariff Mirage
Nearly all of the year-to-date improvement traces back to a single source: customs duties. Tariff revenues surged by $130 billion over the period — roughly three-fifths of total revenue gains, and larger than the entire $94 billion deficit improvement. Strip out tariffs, and the budget actually deteriorated. Corporate tax receipts fell $58 billion, and non-tariff revenue growth of $79 billion was simply no match for $116 billion in new outlays.
This is fiscal improvement by executive fiat, not structural reform. And it’s already fraying. A February 2026 Supreme Court ruling struck down IEEPA-authority tariffs — the source of roughly half of all customs duties collected since January 2025. CBO estimates that ruling alone will add $2 trillion to projected deficits over the next decade compared to the February baseline. Penn Wharton pegs the average effective tariff rate at just 7.1% after the court-ordered regime change. The windfall is leaking.
The Structural Problem Hasn’t Moved
Beneath the tariff noise, the fiscal math remains deeply uncomfortable. CBO’s full-year deficit projection sits at $1.9 trillion, or 5.8% of GDP — well above the 50-year average of 3.8%. Federal debt held by the public hits 101% of GDP this year, reaching 120% by 2036, and a staggering 175% by mid-century.
The composition is the real story. Mandatory spending — Social Security, Medicare, Medicaid — now runs at 14.2% of GDP and is essentially on autopilot. Social Security and Medicare alone will account for 81% of mandatory spending growth through 2036. Discretionary spending, meanwhile, is at its lowest share of GDP since 1962. There is no fat left to cut there. And then there’s interest: net interest costs of $1 trillion this year (3.3% of GDP) will nearly equal all discretionary spending by 2036. The fiscal problem is increasingly an interest-burden loop on top of pre-existing primary deficits, not a conventional spending blowout.
G7 in Context: America Is Not Alone, But It Is Unique
Japan retains the dubious crown of most-indebted G7 sovereign, with gross debt at 204% of GDP against a 2% deficit. The BOJ’s yield curve control legacy has provided remarkable insulation — effective interest costs still run below nominal GDP growth — but IMF projections suggest interest payments could double between 2025 and 2031 as JGBs roll into higher yields. A shrinking BOJ balance sheet and rising foreign investor participation will make that market progressively more sensitive to fiscal news and global risk-off episodes.
Elsewhere in the G7: France runs a 4.9% deficit with debt at 118% of GDP; Italy posts 138% debt; the UK sits at 104%. All three face credibility and repricing risk if growth disappoints. Germany, the outlier, carries just 64.6% debt — but is now choosing to use that fiscal space, with defense and investment commitments pushing debt toward 74% by 2031.
The U.S. sits in a category of its own: very large deficits combined with ownership of the world’s benchmark reserve asset. That combination preserves market access but also means fiscal slippage transmits through term premia, Treasury auction absorption, and global duration markets — not just domestic credit spreads.
What This Means for Portfolios
The risk here isn’t imminent sovereign default — it never was. It’s subtler and more tradeable: rising term premia on long-duration Treasuries, rollover sensitivity ($9.7 trillion in Treasury debt matures in FY2026 alone), and the increasing linkage between sovereign funding markets and leveraged nonbank intermediaries. IMF and GAO both flag that fiscal stress is more likely to surface through auction tails, repo strains, or basis-trade deleveraging than through macro data or ratings actions.
Moody’s and Fitch have both flagged the trend. The message is consistent: U.S. fiscal exceptionalism is eroding faster than Aaa-peer norms. That’s not a crisis call — it’s a duration and liquidity-risk repricing call.
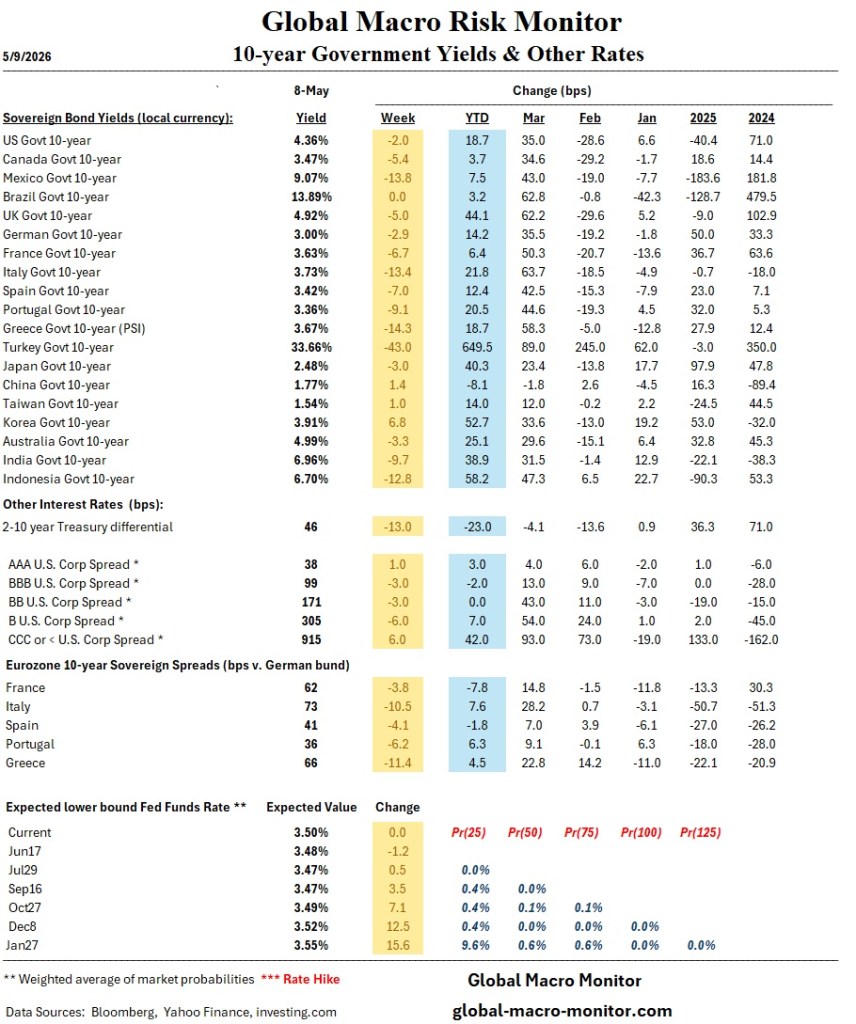
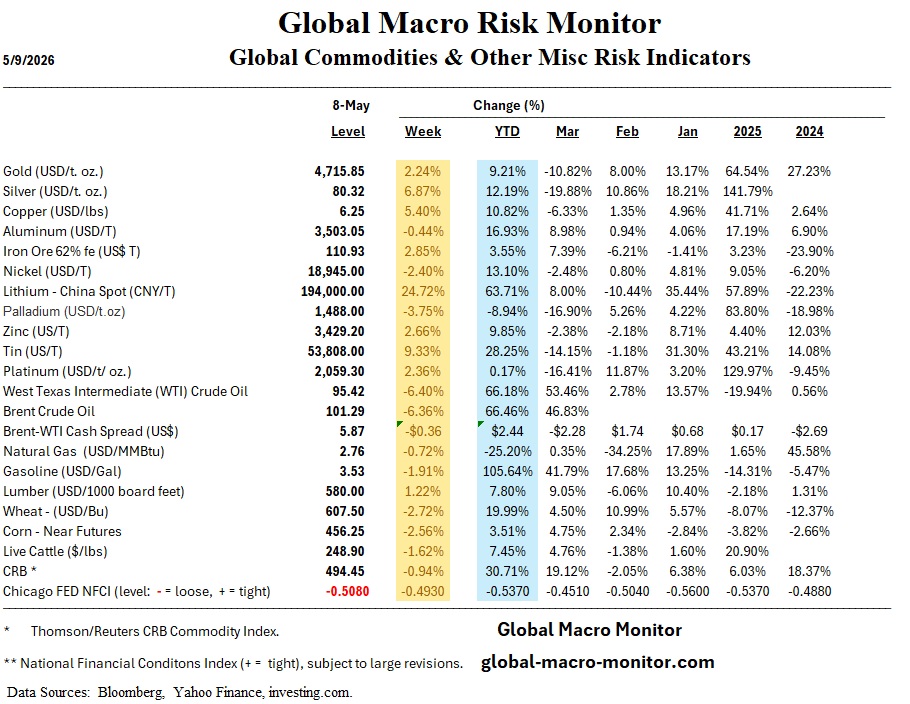
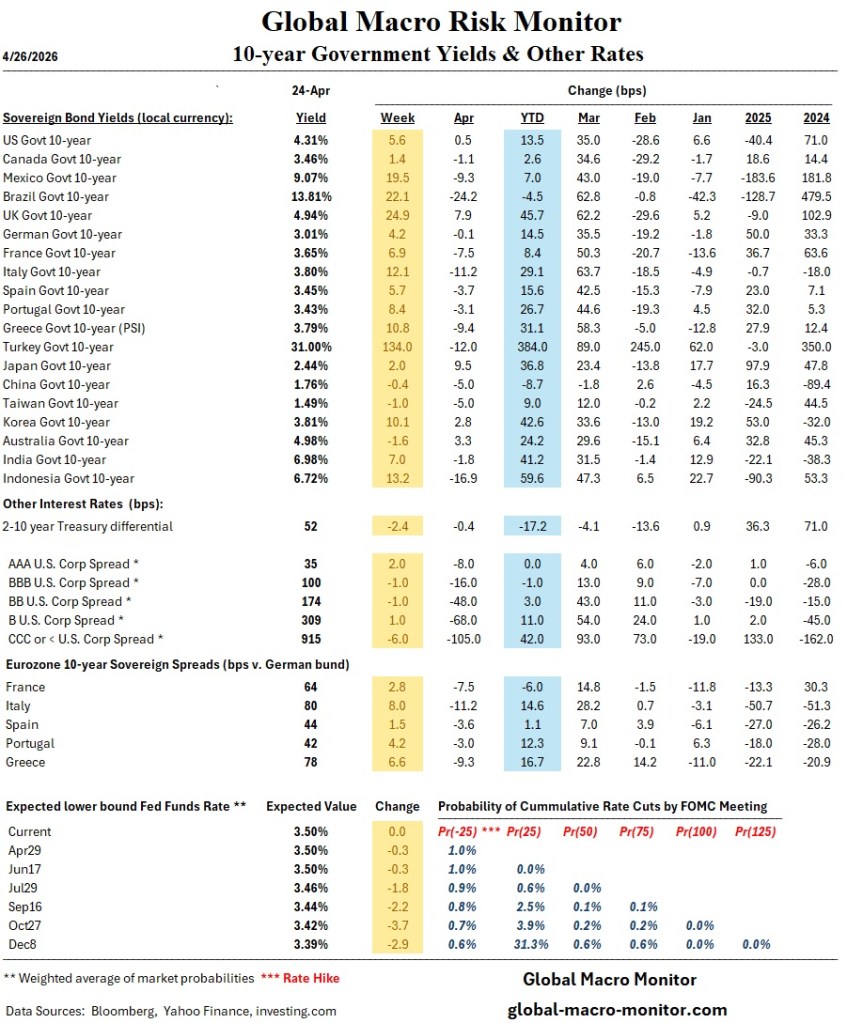
Though it is not easy deconstruct with certainty the reasons for 60 bps pop in 10-year Treasury yields since the end of February, there is no doubt much of the above is playing a role along with the increase in expected inflation.
Position accordingly and stay frosty folks.
Appendix: Presidential Budget Deficits
The conventional political narrative holds that Biden blew up the federal deficit. The data tell a more complicated story, and one that will surprise many.
Presdient Obama left office with the rolling 12-month deficit at a relatively disciplined 3% of GDP. Trump 1.0 then widened the structural deficit to nearly 5% of GDP by March 2020, before the COVID pandemic began to spread in the United States. The pandemic did the rest: emergency spending exploded the deficit to 15.2% of GDP by December 2020. What is rarely acknowledged is that Trump handed Biden a deficit already running at 15% of GDP — among the largest in U.S. peacetime history. Biden’s early months pushed it marginally higher to a peak of 18.1% by March 2021, but the trajectory was largely baked in before the inauguration.
The fiscal shock was too large for private bond markets to absorb. The Fed stepped in as the bond and U.S. Treasury debt buyer of last resort, purchasing 83.6% of all net new Treasury notes and bonds issued between February 2020 and June 2021 — funding 91% of net issuance when incremental T-bills are included. That is digital money-printing at scale, and it is the true origin story of post-COVID inflation in both financial assets and goods and services.
The Oil-Transport Paradox and the “Avis Distortion”
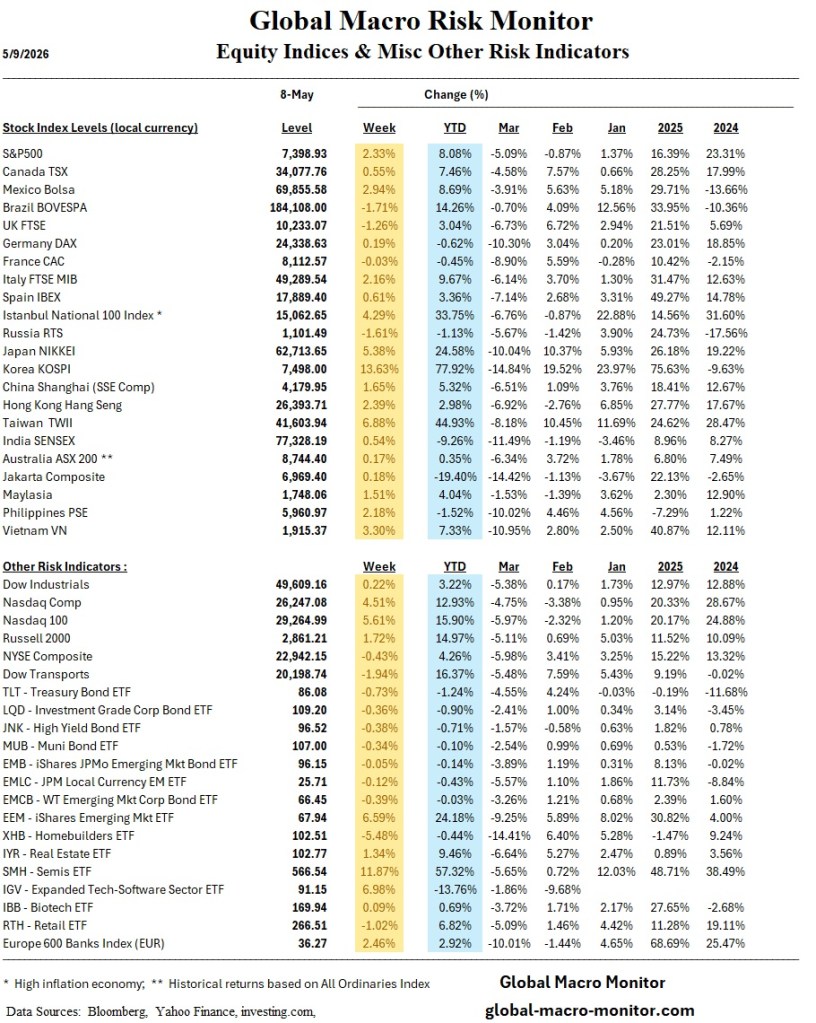
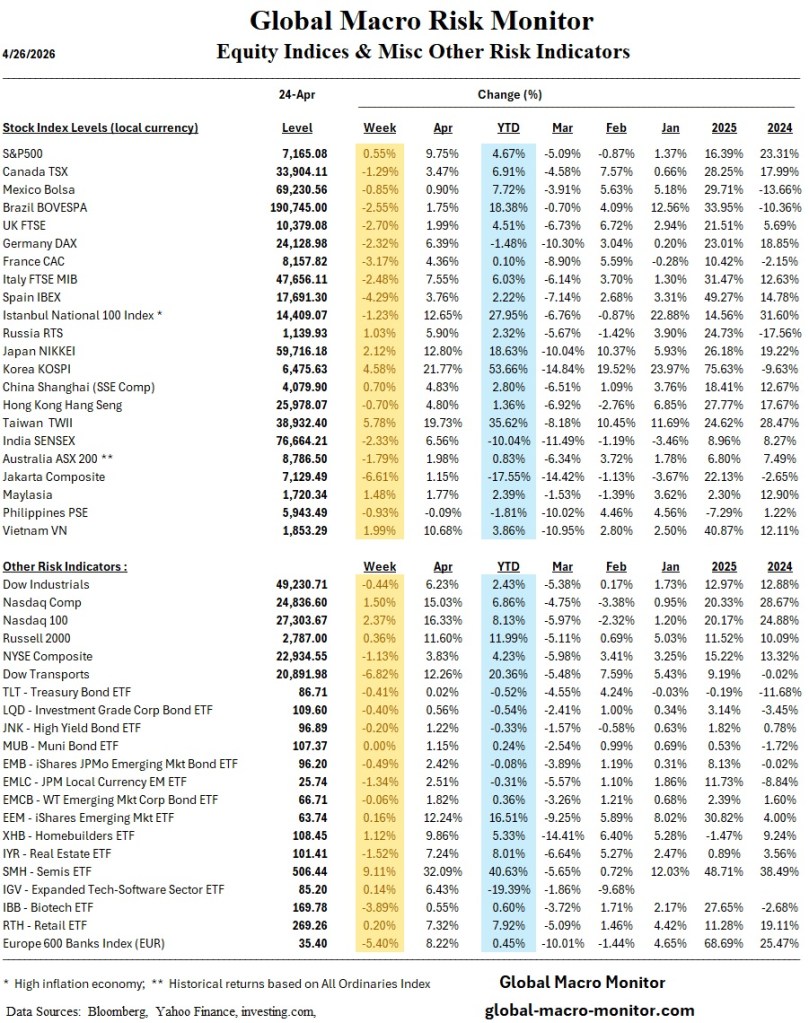
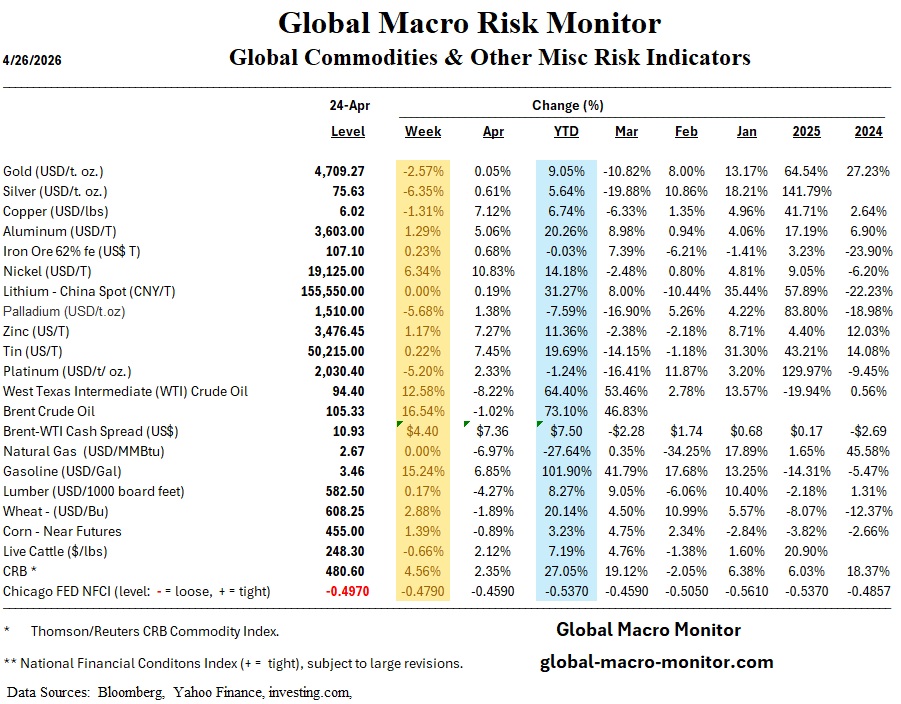
In 2026, the age-old investment rule that “rising oil kills transport stocks” has seemingly been thrown out the window. While WTI crude has skyrocketed 70% year-to-date, a massive cost headwind for airlines and truckers, the Dow Jones Transportation Average (DJTA) has defied gravity, posting significant gains.
But look closer at the index’s mechanics, and you will encounter the “Avis Distortion.” Unlike the market-cap-weighted S&P 500, the DJTA is price-weighted. This means that high-priced stocks carry a disproportionate influence on the index’s total movement, regardless of the company’s actual size. With Avis Budget Group (CAR) undergoing a parabolic short squeeze, its surging share price has effectively propped up the entire index.
Analytical estimates suggest that this single stock’s volatility is responsible for roughly 30% of the index’s YTD point gains. Once you strip away this liquidity-driven anomaly, the true “health” of the broader freight and logistics sector looks far more modest.
Investors relying on the DJTA as a barometer for economic strength should exercise caution. This rally isn’t purely about demand; it is a technical artifact. Distinguishing between genuine operational growth and the Avis Distortion is essential to reading the market’s true pulse.
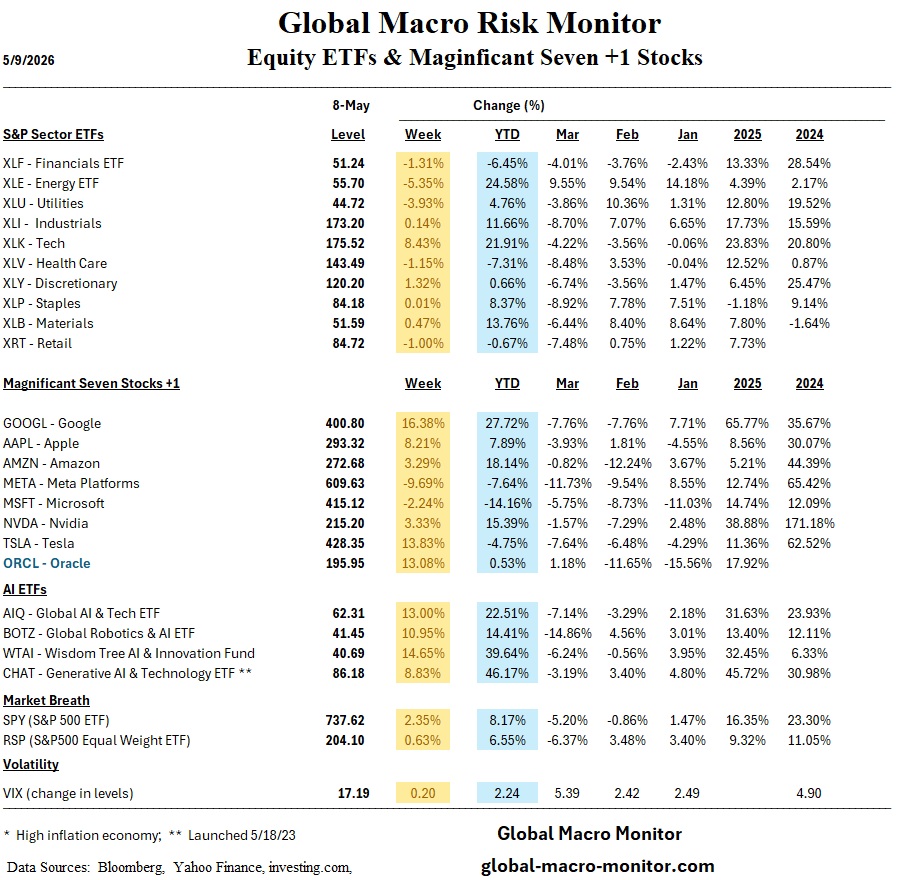
Big Tech’s Moment of Truth: What to Watch This Week
Investors are bracing for a high-stakes week as the market enters a pivotal stretch defined by two major narratives: the “Magnificent 7” earnings bonanza and Jerome Powell’s penultimate Federal Reserve meeting.
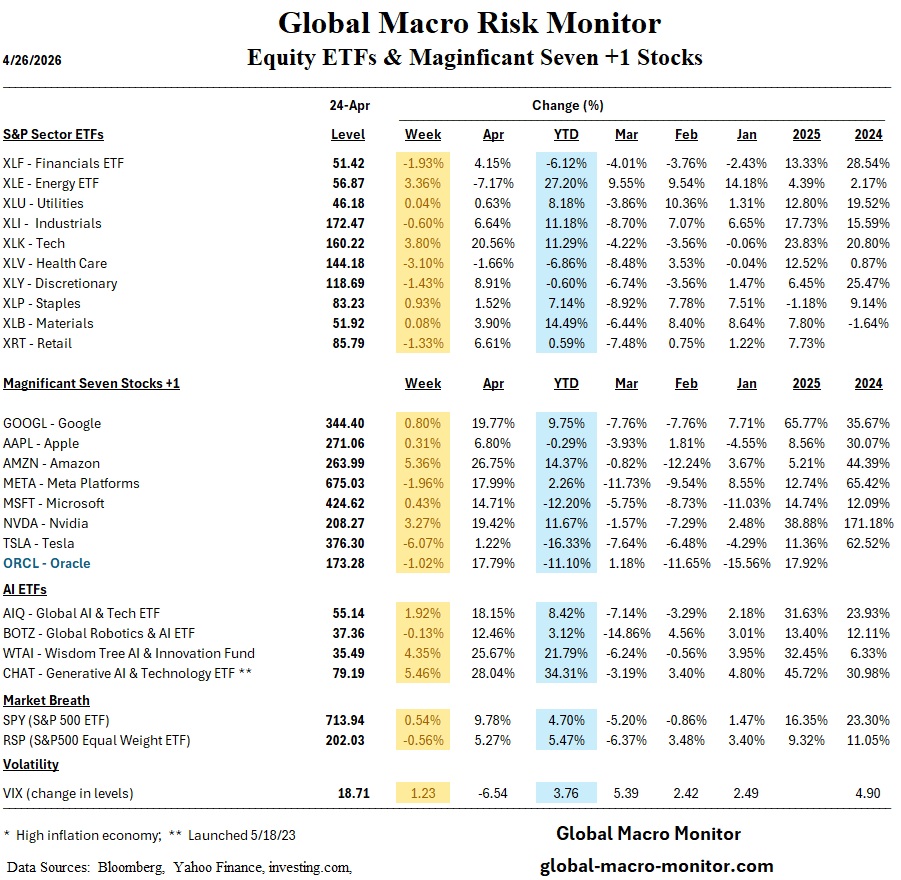
With five of the seven tech giants set to report this week, the focus has shifted dramatically. The debate is no longer just about whether AI demand is real enough to justify massive infrastructure spending. Instead, Wall Street is demanding proof of the Return on Investment (ROI). Analysts will be scrutinizing everything from cloud growth and advertising durability to how these companies are translating massive data center expenditures into bottom-line results. Given that these seven companies now account for over half of the Nasdaq 100’s weight, any earnings disappointments could trigger significant volatility across broader indices.
Simultaneously, all eyes are on Jerome Powell as he nears the end of his tenure as Federal Reserve Chair. As the Fed holds its latest meeting, market participants are looking for signals regarding the path forward for monetary policy in an environment where economic resilience remains the dominant trend.
In short, this week will test whether the current market optimism holds up against the realities of corporate profitability and central bank policy.