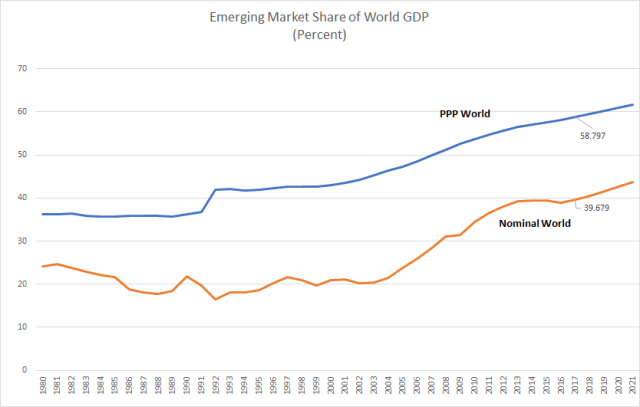
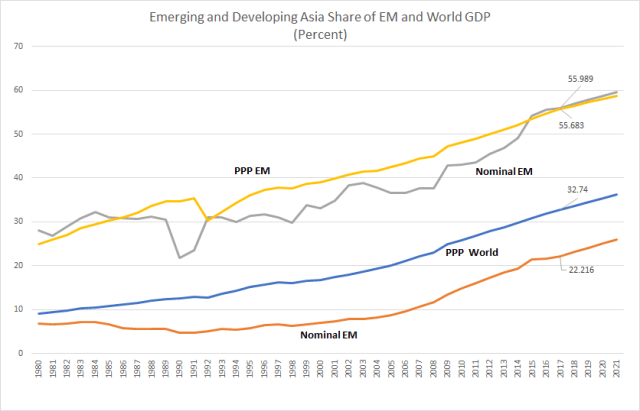
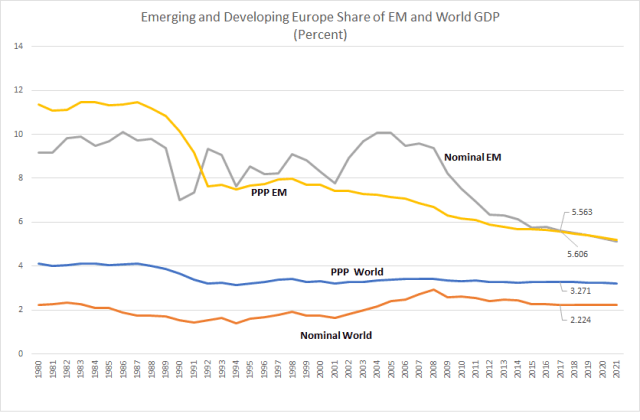
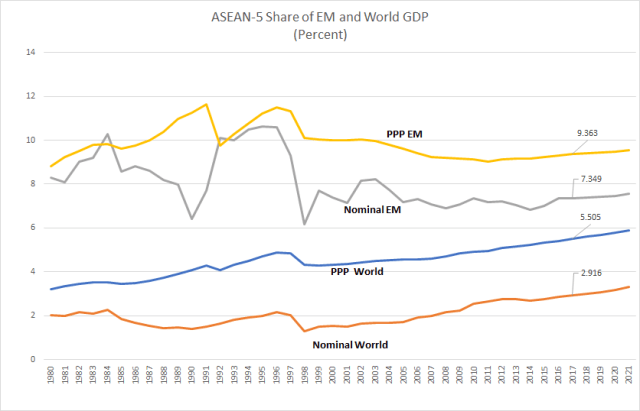
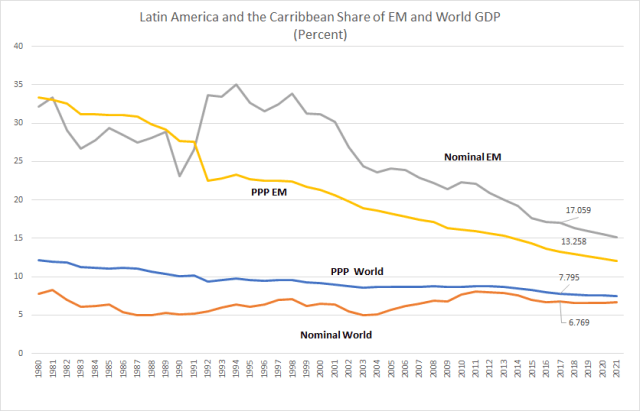
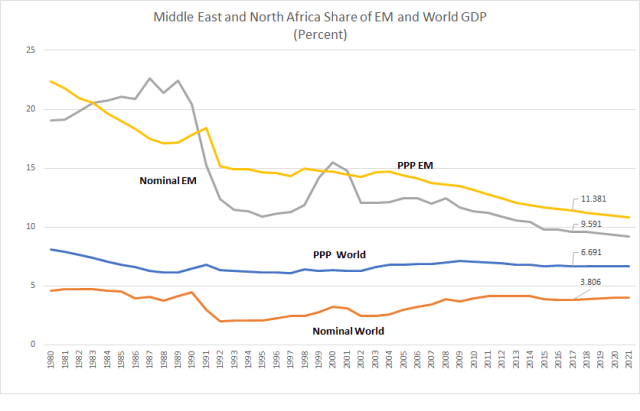
We put together a nice table and some charts of the relative size of emerging market (EM) economies as a percent of World GDP and total EM GDP based on regions. The data are from the IMF’s October 2016 World Economic Outlook.
Note, one can infer from the table and charts if the exchange rates of the regions are overvalued or undervalued on a U.S. dollar purchasing power parity (PPP) basis. For example, if the nominal dollar variable and time series are above the PPP variable and series, exchange rates are overvalued and, conversely, undervalued if below.