
The U.S. budget data are just out, and there’s something happening here. What it is ain’t exactly clear. For what it’s worth, we provide you with our insights.
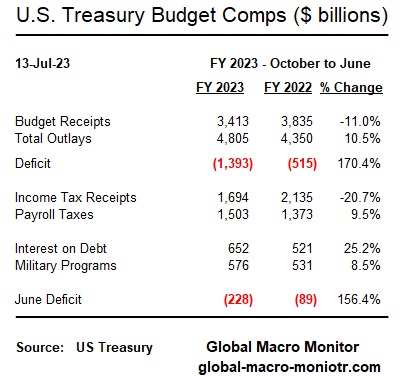
The rolling twelve-month cumulative budget deficit – June to June – has spiked to $2.3 trillion, or based on our estimate of Q2 GDP to around 8.3 percent of GDP. That data point is so far from the number we hear kicked around by analysts that it makes us question our own data, but we can’t find what we are missing.
Just last month, the CBO reiterated their forecast of a $1.5 trillion FY2023 deficit, which ends in September,
CBO’s current projections show a federal budget deficit of $1.5 trillion for 2023 – CBO
Given the deficit is already $1.4 trillion with three more months remaining in the fiscal year, we see zero path to hitting the target.
Today’s CBO report reports some shifts in certain payments added $23 billion to the June deficit (de minimis) and also notes it’s possible the 21 percent decline in income tax revenue,
will be better understood as additional information becomes available; one factor may be smaller collections of taxes on capital gains and other types of income. – CBO
Watch this space, folks. We have no doubt it will soon be on the markets’ radar.
Crowding Out Or More Leverage?
The federal government’s financing needs are massive, and it can no longer depend on the central banks for financing. The financing must come from somewhere and is a zero-sum game unless augmented by increased leverage from other sectors of the U.S. and global economy.
The U.S. budget deficit is now larger than 95 percent of the world’s country GDPs.
The “Leverage Cavalry” is on the way (see the last chart) with a short-term fix but almost certainly a longer-term problem.

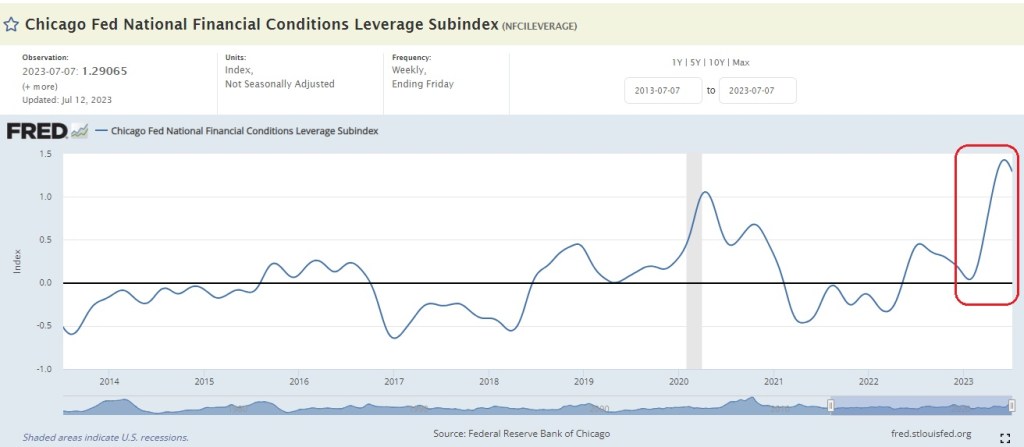
Chicago Fed’s National Financial Conditions Leverage Subindex
By tracking the Chicago Fed’s National Financial Conditions Leverage Subindex, market participants can monitor the level of leverage in the economy and assess its potential implications for financial stability. Increases in the index suggest rising debt burdens and heightened risks of financial distress, while decreases may indicate deleveraging and improved stability.
Stay tuned, folks.

