They will beat their swords into plowshares
and their spears into pruning hooks. – Book of Isaiah

QOTD = Quote of the Day
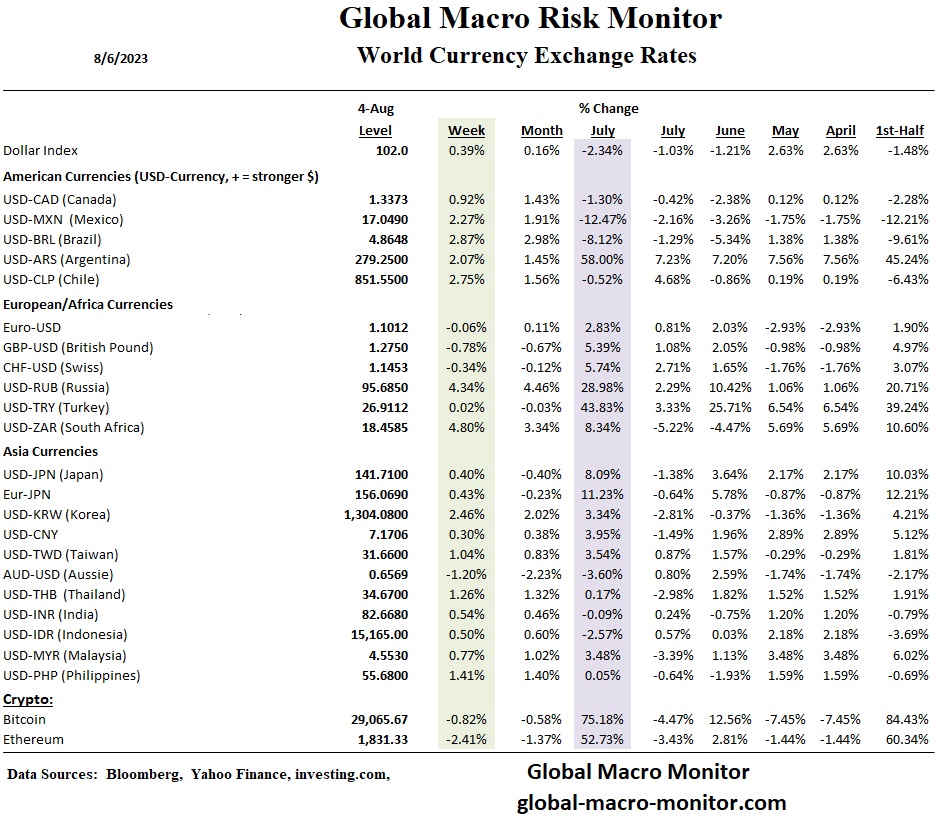
We’ve been sounding the alarm every month and were definitely a lone wolf.
Deficits don’t matter…until they do. – GMM, May ‘23
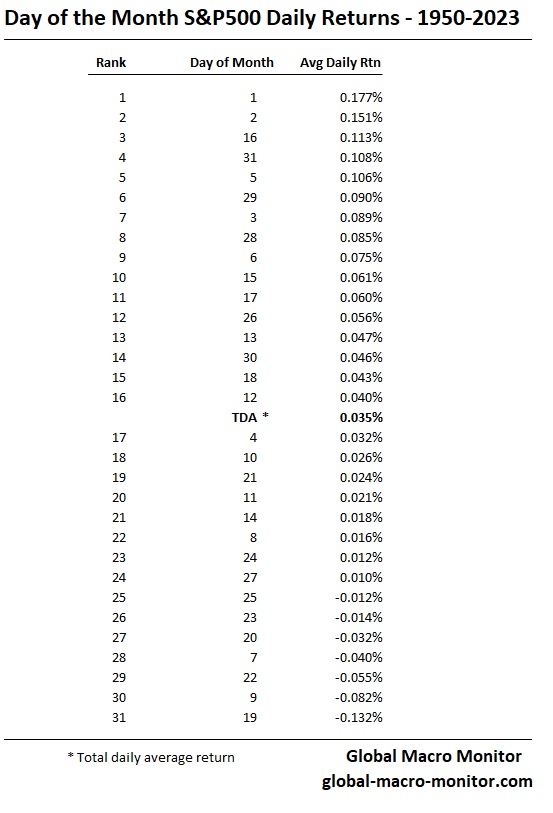
Yes. And it’s significant and intuitive.
The table analyzes daily returns for the S&P500 since 1950 and illustrates the first of the month has returned on average 17.7 bps. That is 14 bps more than the daily average of 3.5 bps. Day one is followed closely by the second day of the month.
Explanation? Our priors are that it results from money flowing into stocks at the beginning of the month, and probably more so if we controlled for quarterly data. We also suspect the 19th day is last and distorted by the huge outlier of the 20 percent plus October 19, 1987 crash. Captain Obvious.
Shouldn’t efficient markets deem such large disparities in day of the month returns impossible, however?
Upshot? Don’t be short stocks on average at the beginning of the month.
Wow, climate change is one helluva a hot “Chinese Hoax.”
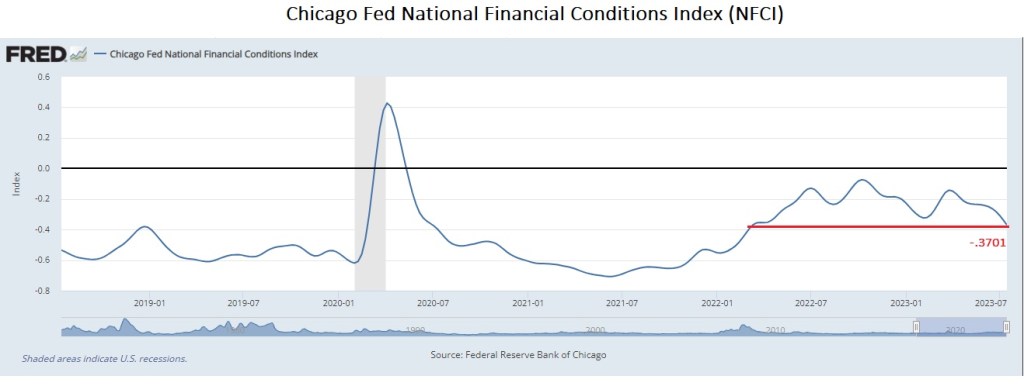
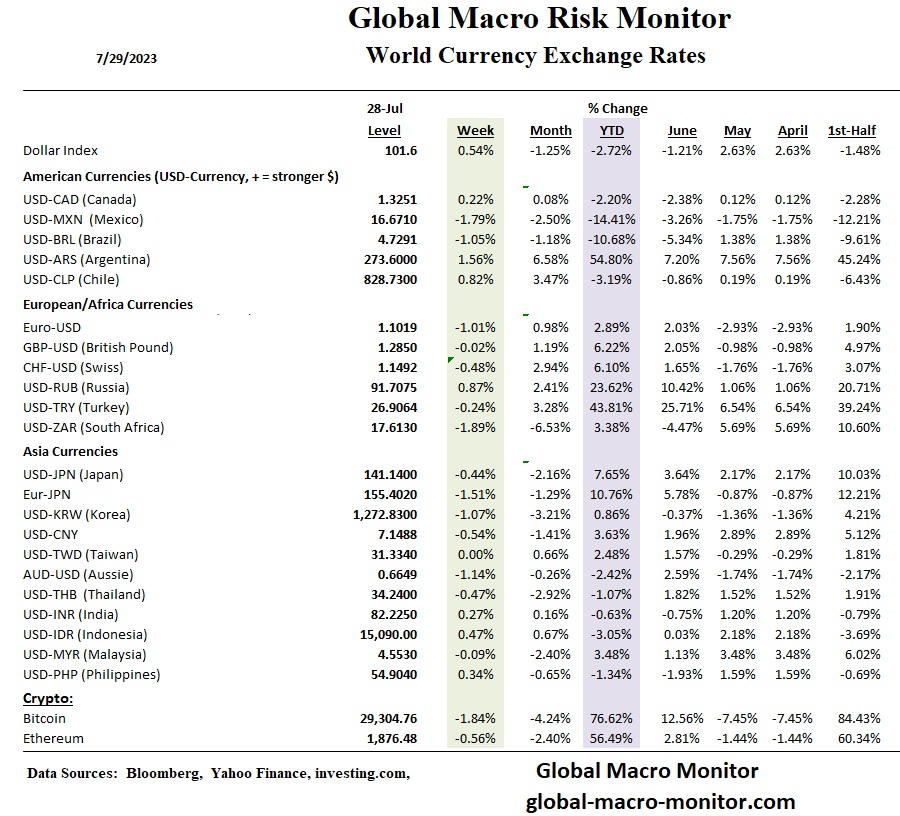
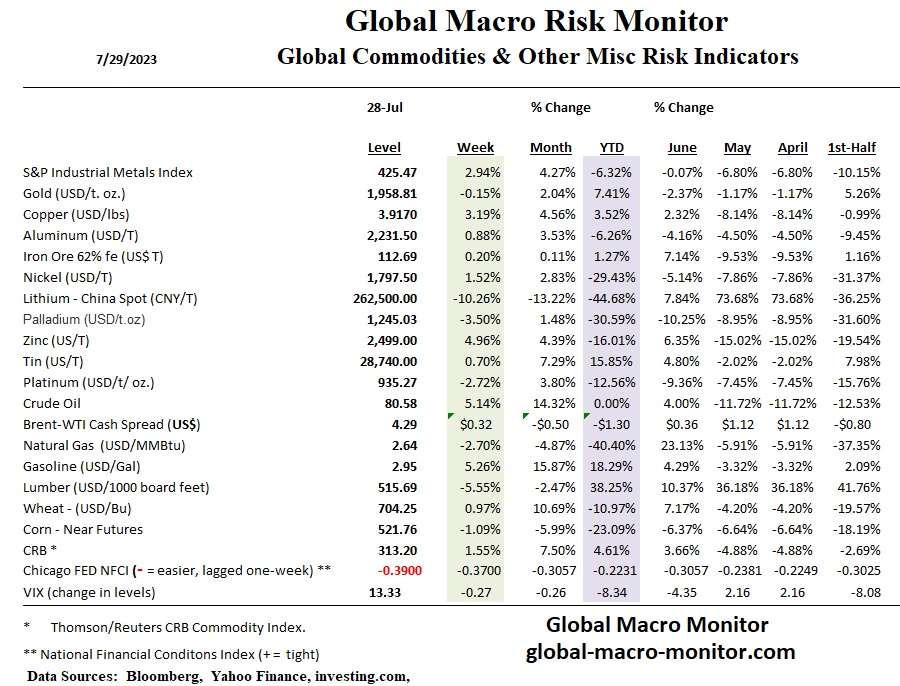
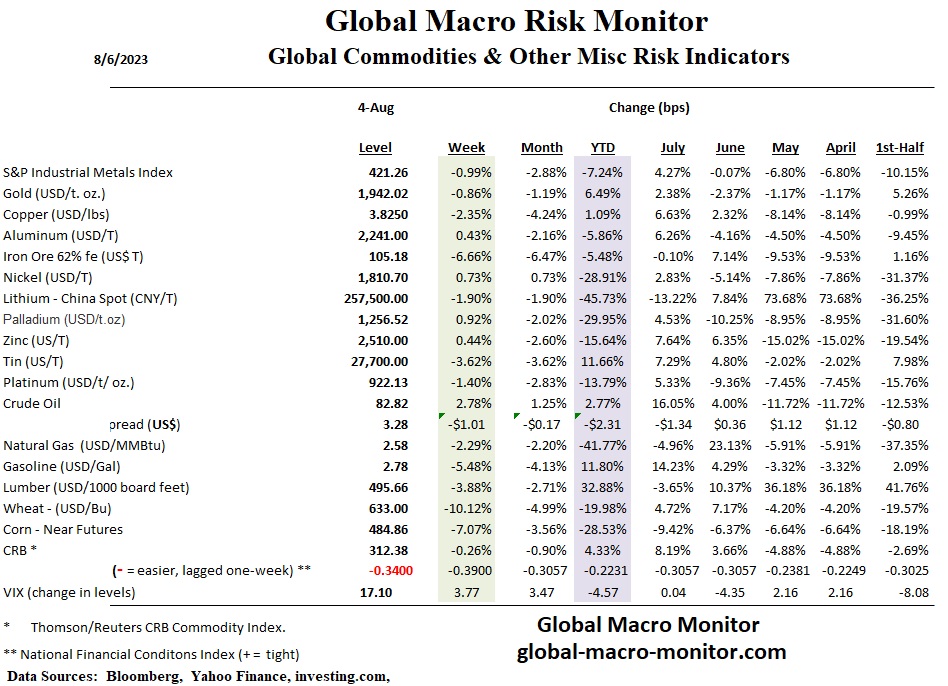
We are amazed that even after over 500 bps of policy rate increases, financial conditions, as measured by the Chicago Fed’s NFCI, are as loose as they were back in March 2022, when the Fed Funds rate was around 25 bps.
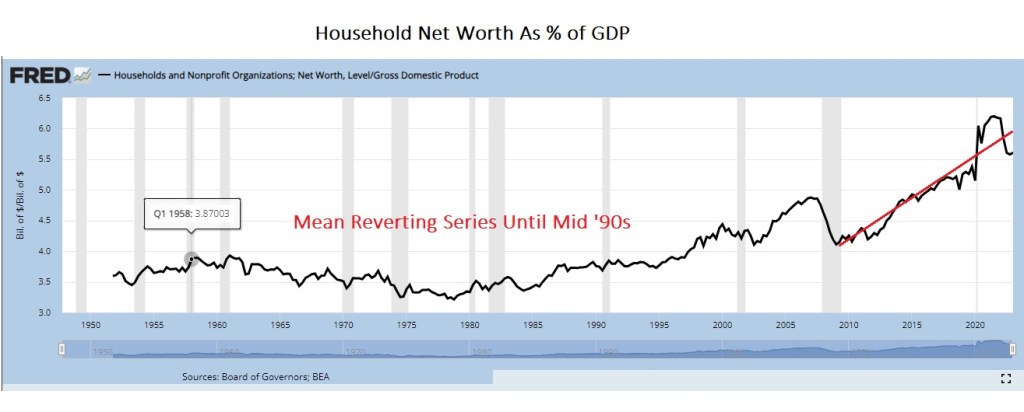
It’s also quite surprising that household wealth, our preferred “loose” measure of the aggregate “money” supply stock, is turning up again. We estimate the current level is around 5.8x nominal GDP. In theory, this metric should be mean reverting as it was for almost fifty years before the mid-1990s.
Our priors are globalization, technological advances, China and Eastern European labor forces entering the global labor market, among other things, have hallowed U.S. aggregate demand, and the Fed has been forced to use monetary policy, primarily through quantitative easing, to inflate asset prices above historical norms to keep demand above the waterline.
Furthermore, our working hypothesis is that the Fed’s inflated balance sheet still supports the asset markets and keeps household wealth, which is grossly skewed to the top 10 percent of households, at the extreme levels driven up by the emergency COVID monetary injections. At some point, quantitative tightening will begin to bite the asset markets. Thus far, however, they have yet to be chastened.
Upshot = Hawkish Fed
The Fed is going to have to remain hawkish, as they even understand that “wealth without work” or production is one of the deadly sins of monetary policy, which was painfully discovered during the past few years.
We wouldn’t be surprised to hear Chairman Powell express his frustrations and highlight, in red, the easing of monetary conditions, which is a headwind to the Fed’s effort to slow aggregate demand, at the FOMC meeting this week. Wait for it.
Alan Greenspan had a similar dilemma in the mid-aughts, which he labeled the bond market conundrum, where the yield curve wouldn’t cooperate with the Fed’s tightening cycle, allowing the housing and credit bubble to expand even further. Monetary policymakers were forced to keep tightening until the markets and the economy broke.
As always, we are contrarian and reserve the right to be wrong, as we often are, but love the thought experiment.