We define efficiency here as the dollar cost per win this season.
$ per win = total team salary/wins
Of course, costs per win will decrease as the denominator increases as teams play more games and finish the season.
So far, the Orioles are the most efficient, spending $1.2 million per win while having a winning percentage above .600 percent. Conversely, the Mets are the most inefficient, spending almost $7 million per win, with the Yankee’s not far behind, shelling out $6.5 million per win.
It’s also interesting that the trendline of dollars per win versus winning percentage is negative. Money can’t buy me love, nor buy me baseball wins.
Efficiency, as we define it, does not necessarily equate to winning World Series. Nevertheless, we are enjoying a little schadenfreude, watching the Davids slay the Goliaths. Sorry Mets fans.


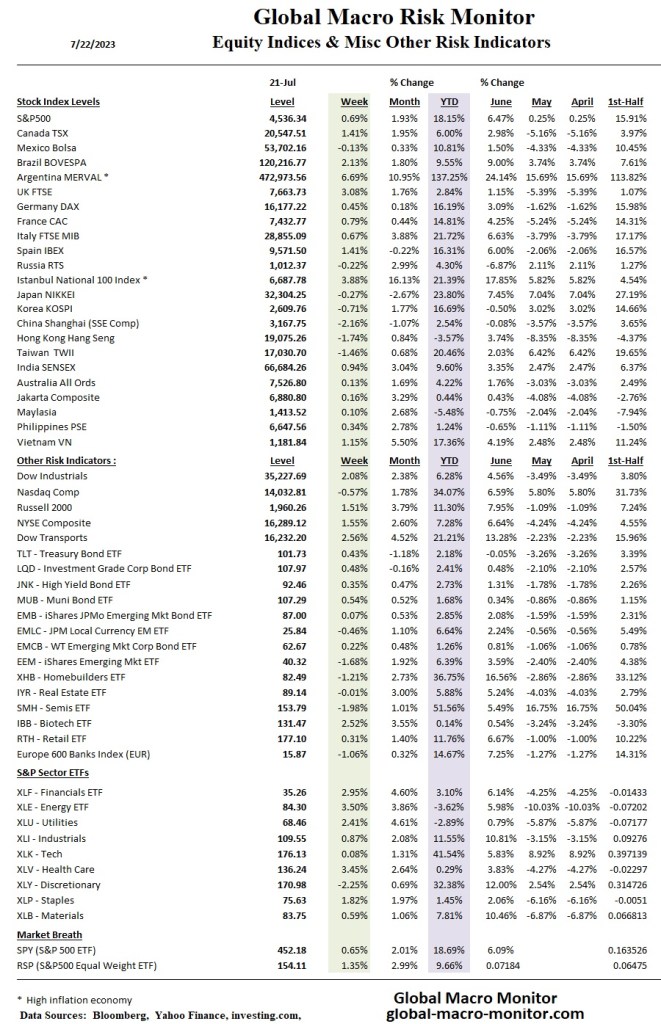
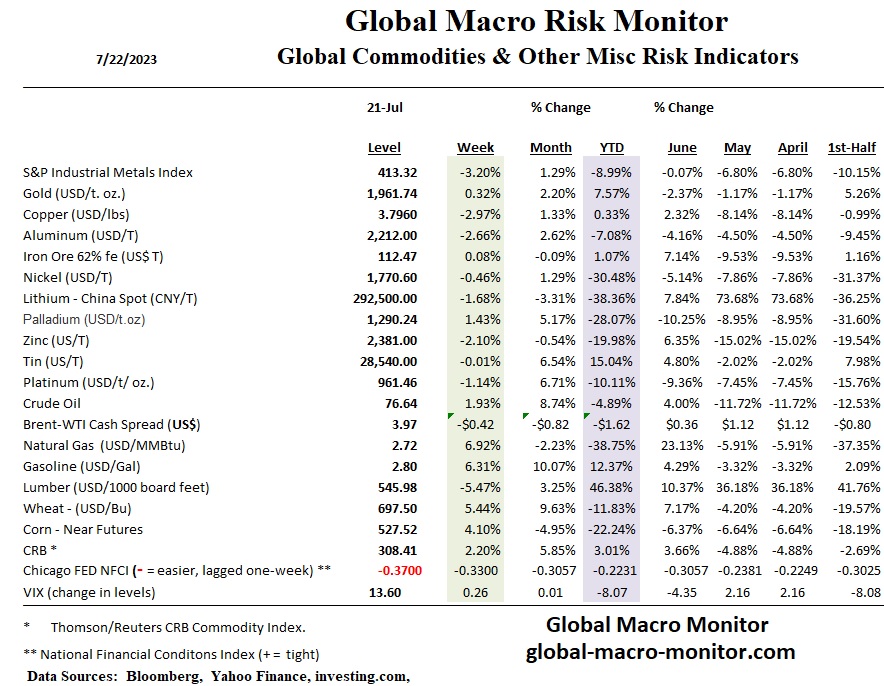
Wow, stunning that financial conditions, as measured by the Chicago Fed’s National Financial Conditions Index, (see last table), are as loose as they were back in April 2022, when the Fed Funds upper limit was at 50 bps versus 5.25 percent today. Markets love it, but the Fed must be shitting razor blades. They’ve got a tiger by the tail as they wait (and fret) for quantitative tightening to bite.
The U.S. central bank has only taken back about 14 percent, around $670 billion, of the almost $5 trillion they injected into the financial system during the pandemic. We maintain there should be more of a focus on the quantity of money, which we define very loosely under the umbrella of household wealth, rather than obsessing over the price of money or interest rates. Stay tuned.


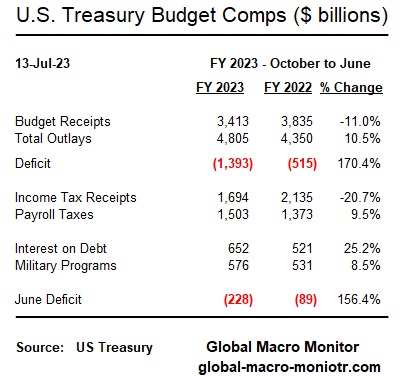
The U.S. budget data are just out, and there’s something happening here. What it is ain’t exactly clear. For what it’s worth, we provide you with our insights.
The rolling twelve-month cumulative budget deficit – June to June – has spiked to $2.3 trillion, or based on our estimate of Q2 GDP to around 8.3 percent of GDP. That data point is so far from the number we hear kicked around by analysts that it makes us question our own data, but we can’t find what we are missing.
Just last month, the CBO reiterated their forecast of a $1.5 trillion FY2023 deficit, which ends in September,
CBO’s current projections show a federal budget deficit of $1.5 trillion for 2023 – CBO
Given the deficit is already $1.4 trillion with three more months remaining in the fiscal year, we see zero path to hitting the target.
Today’s CBO report reports some shifts in certain payments added $23 billion to the June deficit (de minimis) and also notes it’s possible the 21 percent decline in income tax revenue,
will be better understood as additional information becomes available; one factor may be smaller collections of taxes on capital gains and other types of income. – CBO
Watch this space, folks. We have no doubt it will soon be on the markets’ radar.
Crowding Out Or More Leverage?
The federal government’s financing needs are massive, and it can no longer depend on the central banks for financing. The financing must come from somewhere and is a zero-sum game unless augmented by increased leverage from other sectors of the U.S. and global economy.
The U.S. budget deficit is now larger than 95 percent of the world’s country GDPs.
The “Leverage Cavalry” is on the way (see the last chart) with a short-term fix but almost certainly a longer-term problem.

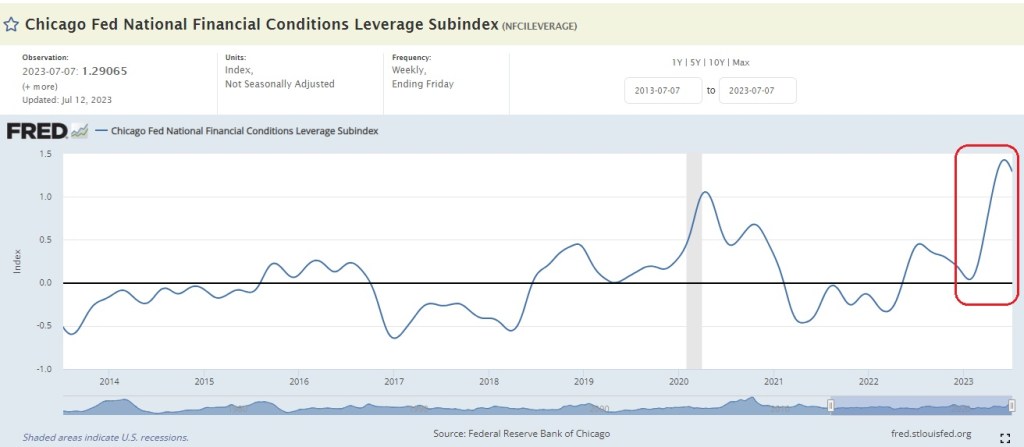
Chicago Fed’s National Financial Conditions Leverage Subindex
By tracking the Chicago Fed’s National Financial Conditions Leverage Subindex, market participants can monitor the level of leverage in the economy and assess its potential implications for financial stability. Increases in the index suggest rising debt burdens and heightened risks of financial distress, while decreases may indicate deleveraging and improved stability.
Stay tuned, folks.
After a read of the recently released manufacturing and services Purchasing Managers Index (PMI) reports for June, goods prices are softening significantly. However, the service sector is still experiencing price pressures, albeit at a deaccelerating rate.
Services comprise over 60 percent of the CPI, with shelter around 35 percent of the basket.
Even though the manufacturing sector is in contraction, hiring continues as if the employers are hoarding workers, similar to how consumers hoarded toilet paper during the panic. Granted, the employment data is a lagging indicator, but recency bias is a real bitch to break.
Nevertheless, we are taking the under on tomorrow’s core inflation print. Our recency bias, which we own, is that manufacturing prices tend to lead the headline inflation data, which is underreported.

For example, a special surcharge appears on our bill every time we dine out. A 3.5 percent surcharge was added to the bill at brunch on Sunday! Argh! We’ve seen labor, transport, and energy surcharges, just to name a few. Check your bills, folks
PMI Price Components:
Here is our summary of the PMIs with a little help from our AI friend:
In June, the U.S. manufacturing sector experienced a decline in input costs for the second consecutive month, with material prices dropping the most since May 2020. Suppliers offered promotions to incentivize purchases of inputs. Only one manufacturing industry reported price increases in June, while the majority reported either the same or lower prices. Despite weak demand, manufacturers hired new workers.
On the other hand, the U.S. services sector faced higher cost burdens due to supplier shortages, increased interest rates, and higher wage bills. Input prices rose at the fastest pace in five months, but efforts to remain competitive led to slower increases in charges. However, service sector firms saw a significant rise in cost burdens, primarily driven by higher wage bills, supplier prices, and borrowing costs. Cost inflation accelerated, reaching its highest level since January. Twelve service industries reported increased prices, while three reported price decreases.
Place your bets!