
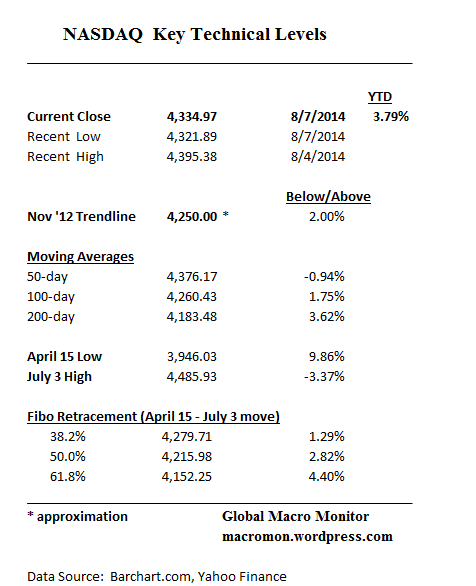
The Nasdaq is holding up better than the S&P500 and Dow, off only 3.37 percent from its recent high, and yet to test its 100-day. The index has even yet to break its 38.2 Fib retracement of the April 15 to July 3 move. Nevertheless, the Nasdaq has pierced some minor support at 4,350 (see chart). Tough call as to whether it swan dives to catch up with other indices on the downside or holds in and leads the market out of its current funk. We choose risk aversion. Stay tuned.

 (click here if charts are not observable)

