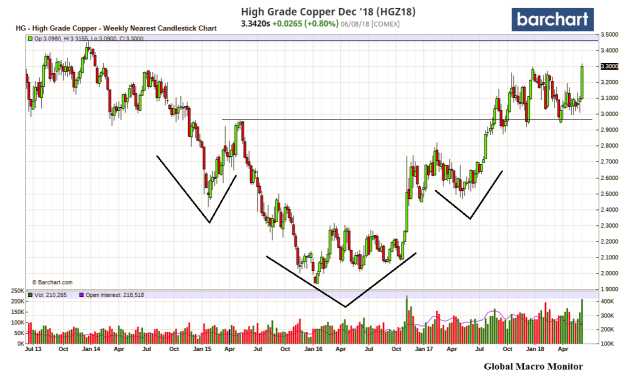
Classic inverse head & shoulders pattern for the weekly nearest copper futures chart. The break out above 2.961 puts a measured move to 3.94 in play, which is about 20 percent above the current level. The next big number for upside resistance is 3.466.
A new bull market for copper? Stay tuned.