
Forced Liquidation

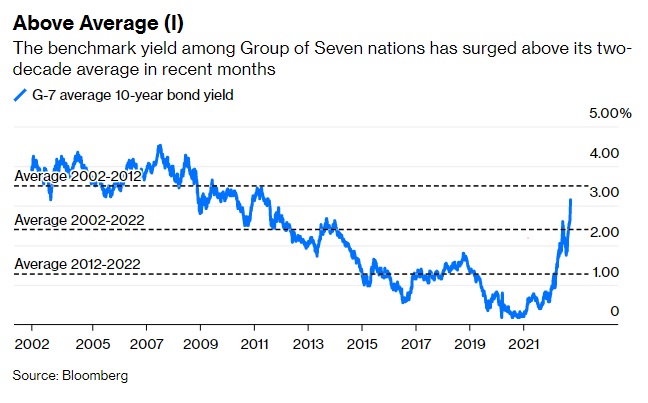
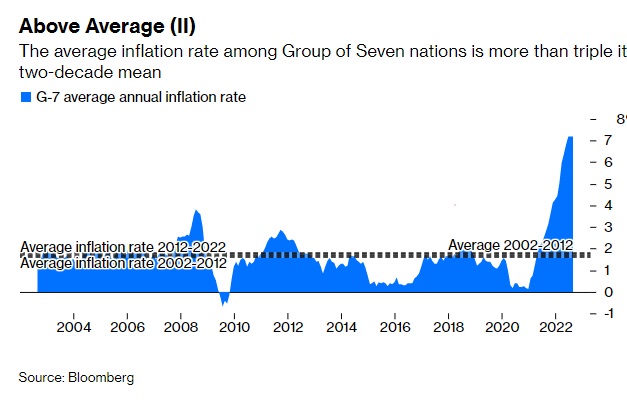
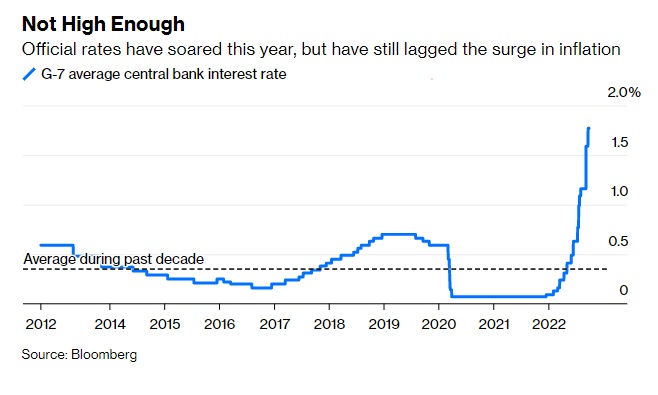
G7 Yields, Inflation, & Policy Rates
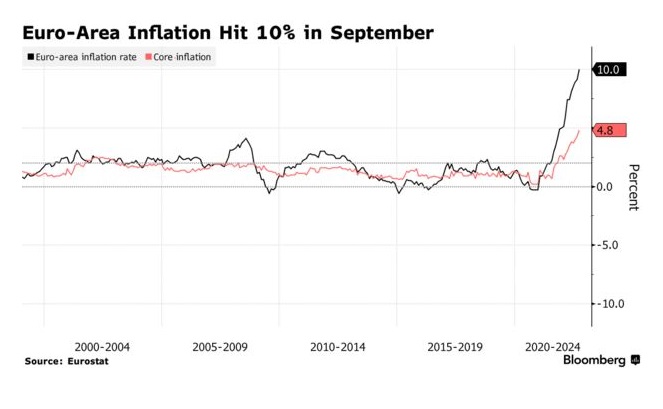
Euro Inflation Spike
German Inflation Soars

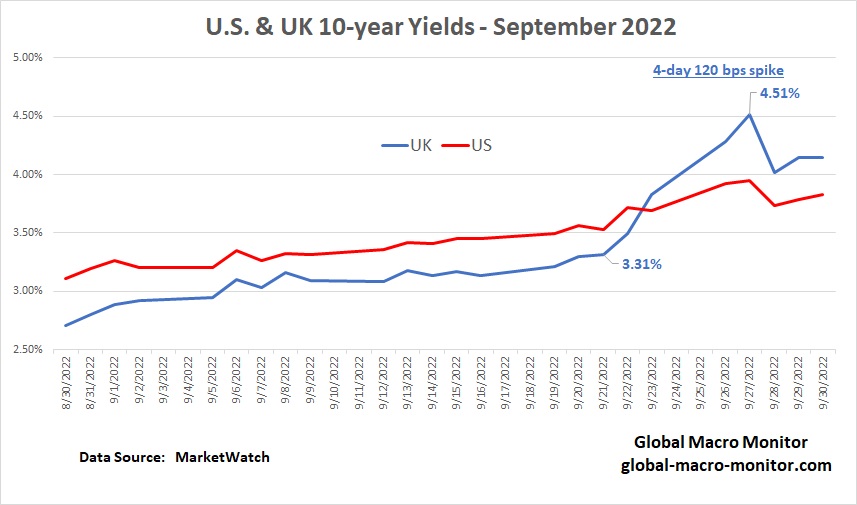
Gilts Gone Wild
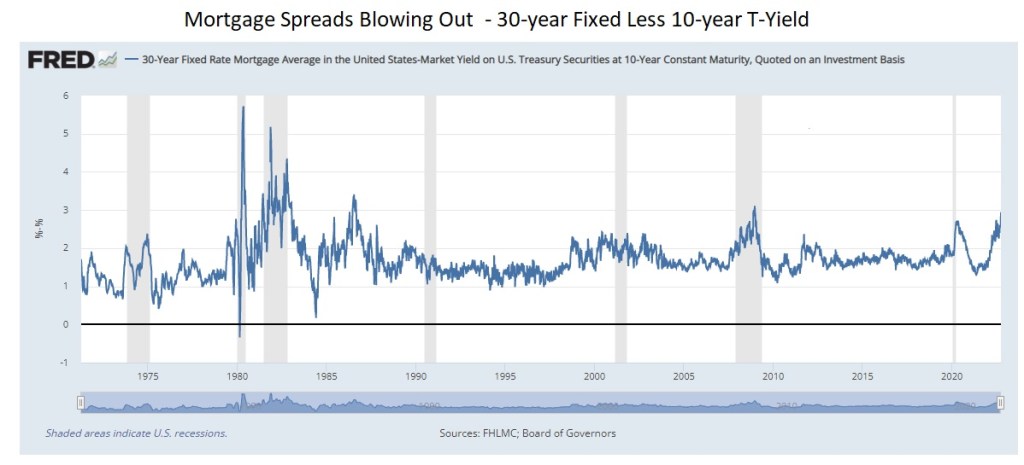
Mortgage Spreads Blowing Out
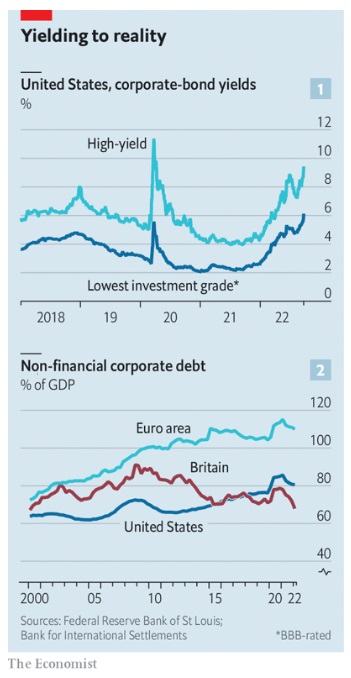
Cue The Corporate Debt Reckoning
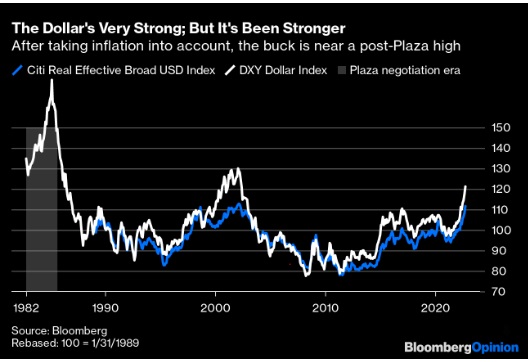
Dollar Strength In Context
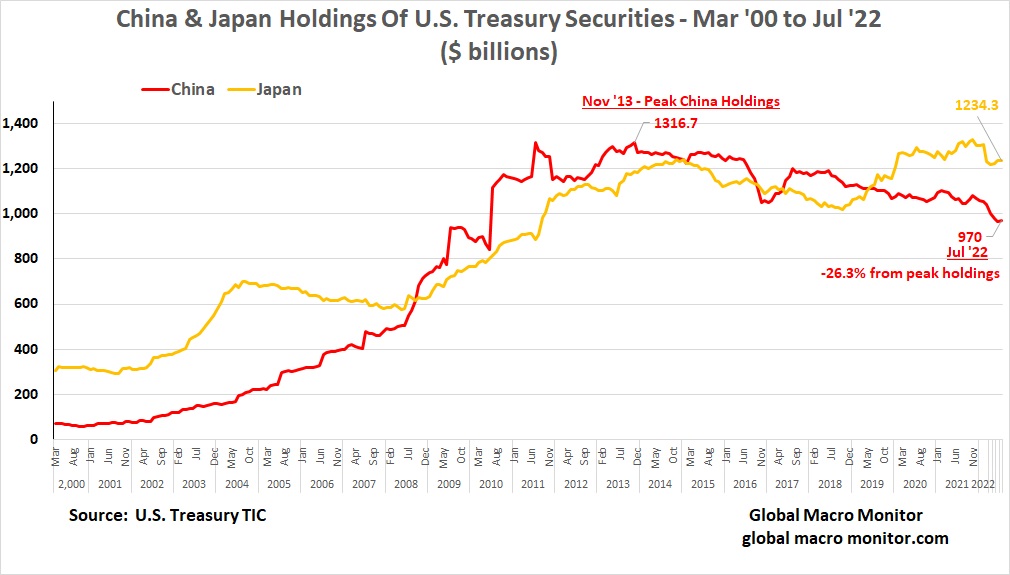
China Selling U.S. Treasuries
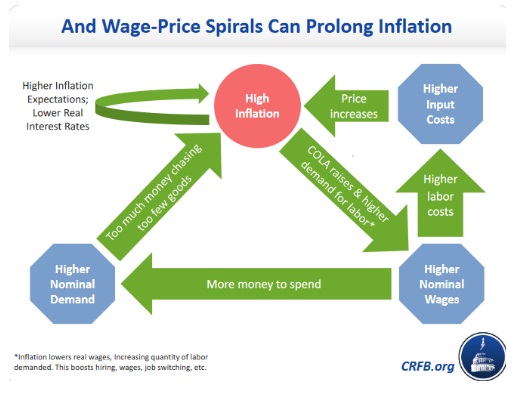
Inflation 101: The Wage-Price Spiral
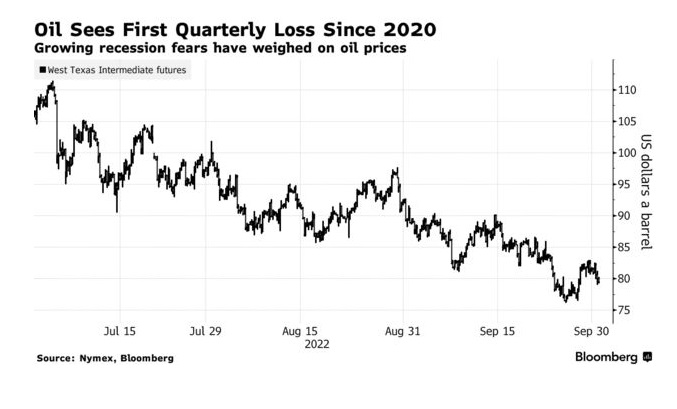
Hitting An Oil Slick
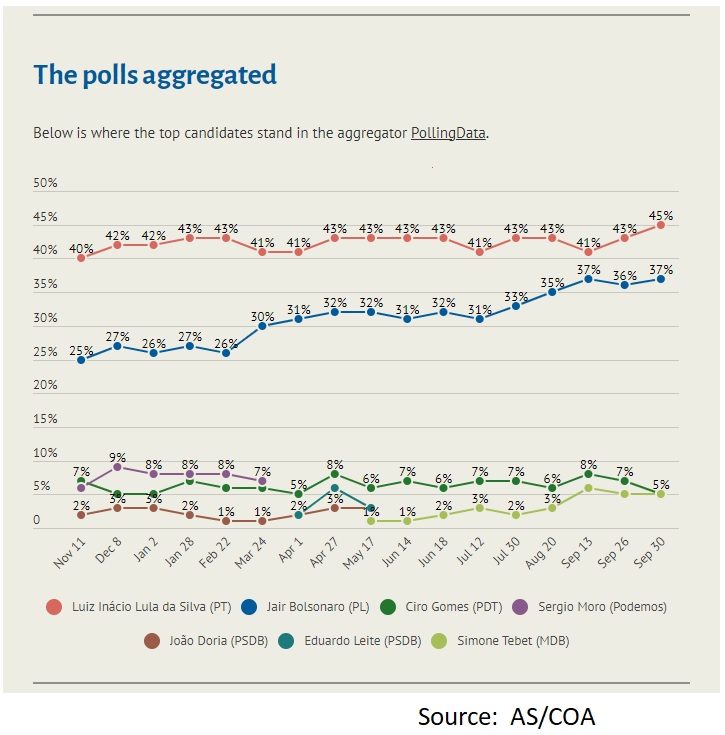
Can Brazil’s Lula Get To 50% On Sunday?
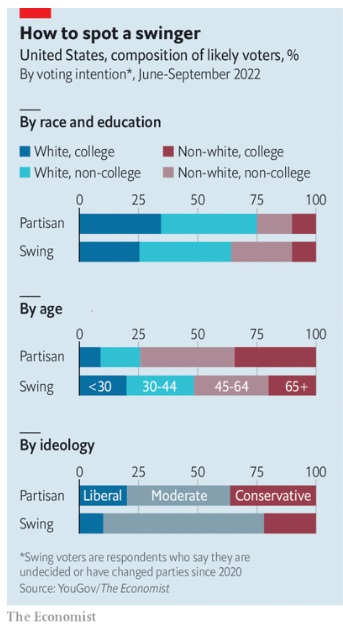
How To Spot A U.S. Political Swinger
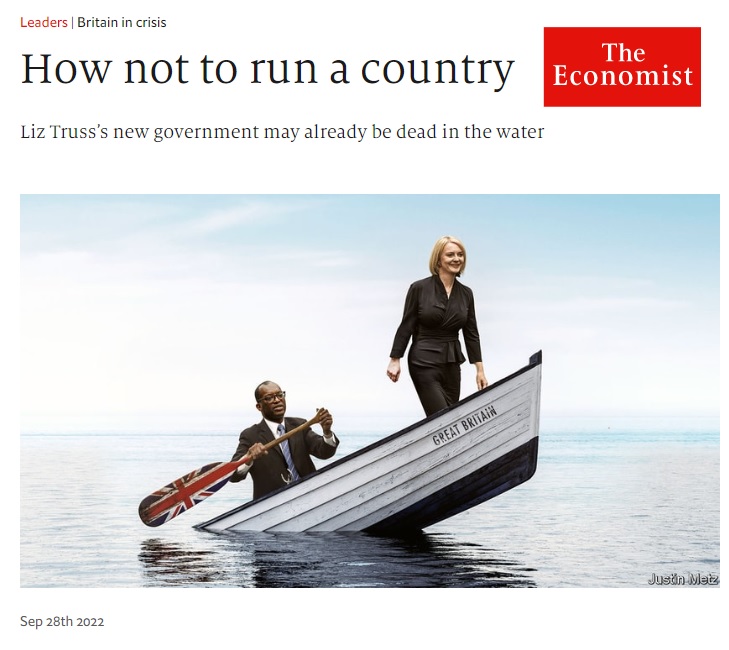
How Not To Run An Economy
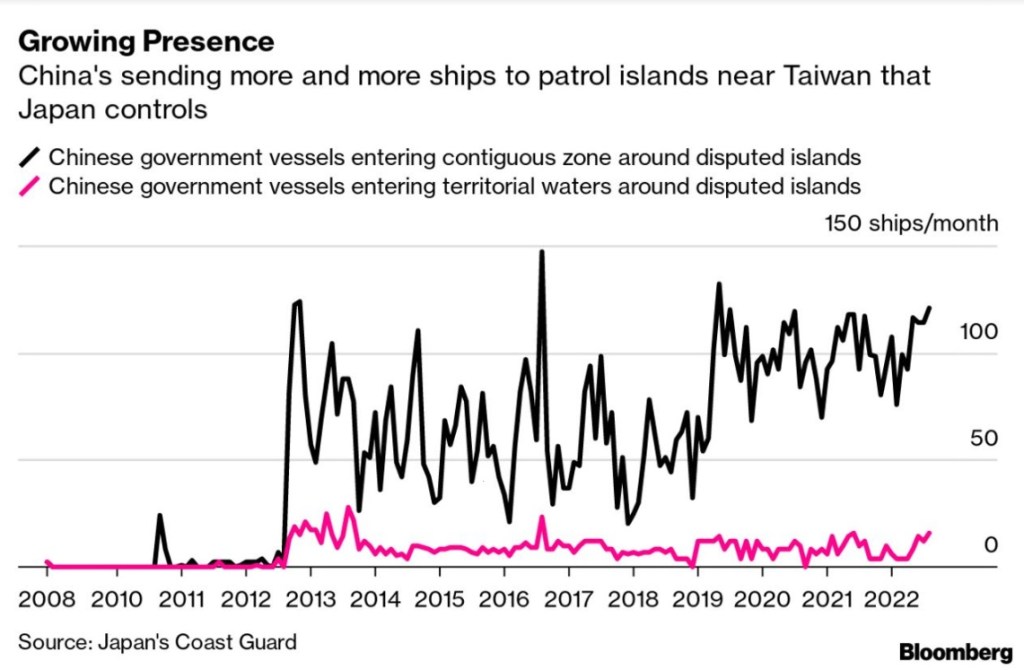
China Increasing Naval Presence Near Taiwan
The World’s Most Powerful Man


Glad to see the UK get a mention!
Here is Varoufakis commenting on the lineage of the decline and prevalent zombie economic ideas there…https://www.theguardian.com/commentisfree/2022/oct/01/trickle-down-liz-truss-thatcher-blair-osborne-britain-keir-starmer
And its likely going to take a while
9.58
1 Year Treasury Rate – 54 Year Historical Chart
1 Year Treasury – Historical Annual Data
Year Average Closing Price Annual % Change
1985 8.42 -17.57%
1984 10.91 -8.53%
1983 9.58 16.13%
10-Year Treasury – Historical Annual Yield Data
Year Average Yield Year Low
1983 11.10% 10.12%
1982 13.01% 10.36%
1981 13.92% 12.11%