COTD = Chart of the Day

COTD = Chart of the Day
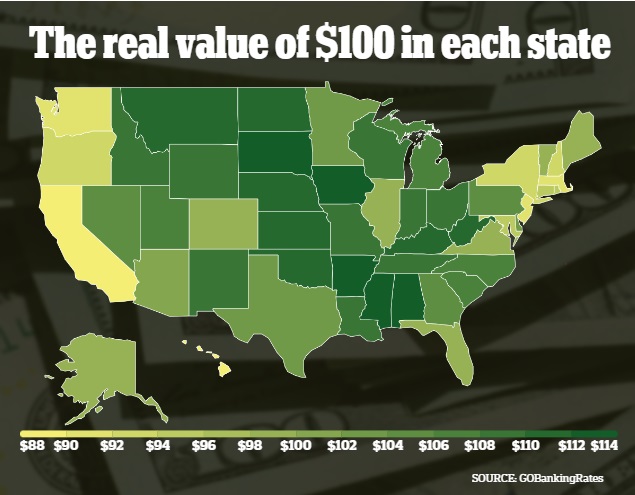
Although $100 may appear to have uniform purchasing power across the United States, the reality is far more nuanced. The purchasing power of money can vary significantly between states, with some regions offering a substantially higher value of spending than others. While it is commonly understood that the cost of living in Arkansas is lower than in California, the extent of these regional disparities is often underappreciated.
To quantify how far $100 stretches in each state, GOBankingRates analyzed data from authoritative sources, including the U.S. Bureau of Economic Analysis, the Bureau of Labor Statistics, and Zillow. This comprehensive data offers valuable insights into why $100 holds greater value in some states than others.

Key Facts:
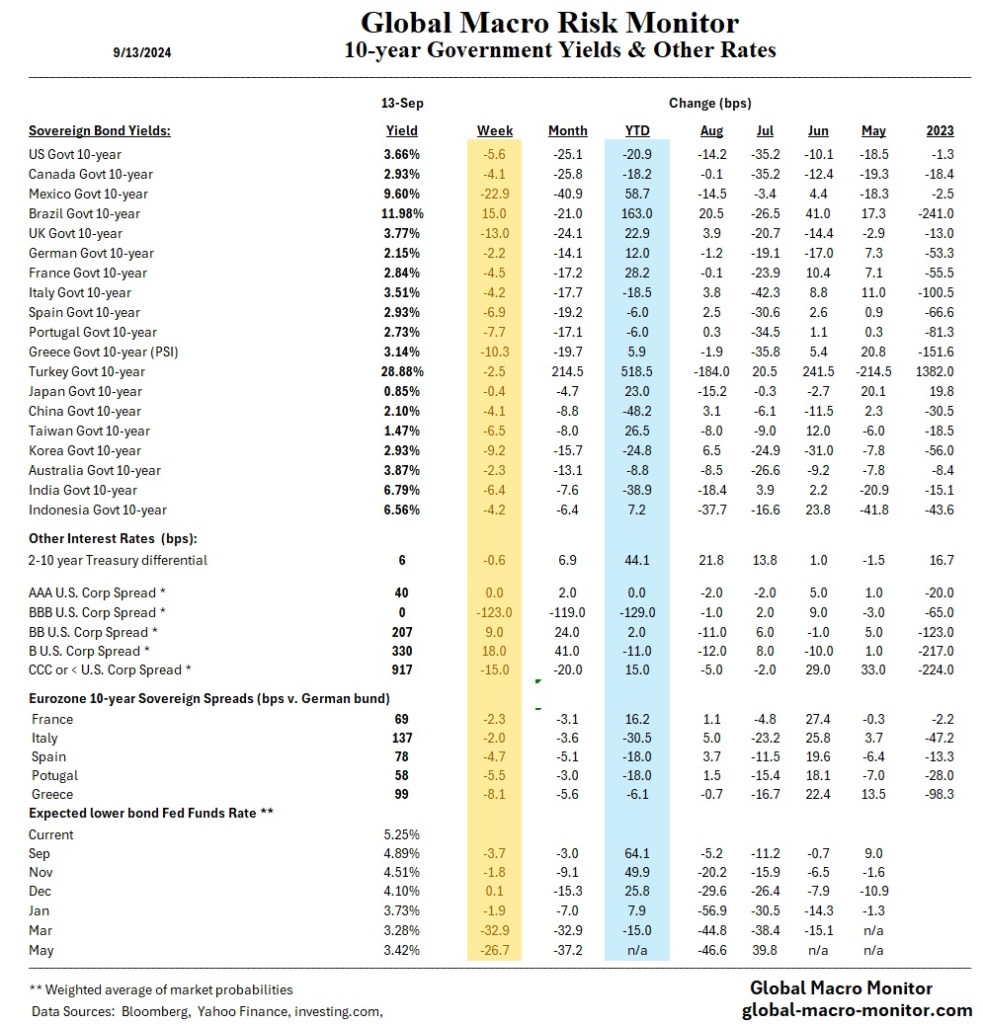
According to the Bureau of Labor Statistics, the Consumer Price Index (CPI) rose by 0.2% in August, replicating the July print. The year-over-year inflation rate dropped to 2.5%, the lowest since February 2021, approaching the Fed’s two percent target level. Core inflation, which excludes food and energy, increased by 0.3% for the month, a smidgen above expectations and bringing the 12-month core CPI to 3.2%. Shelter costs are still sticky, rising 0.5%, while food prices increased slightly by 0.1%. Energy costs fell, with the gasoline index falling by 0.6%. The data set the stage for the Federal Reserve’s upcoming meeting, where traders expect an 85% chance of a 25-basis-point interest rate cut. Real earnings increased, with average hourly wages outpacing inflation by 0.2%. However, persistent shelter and core services inflation may prevent more aggressive rate cuts. The labor market is slowing, and caution is being shown to the Fed about further economic softening.


It was early August 2001 when I asked my wife if we should fly into Washington, D.C. a few days early before my best friend’s wedding. He was planning to marry his sweetheart on September 16, 2001, at St. John’s Episcopal Church. My 6 and 3-year-old daughters and I were in the wedding party.
I wanted some extra time for the girls to see the great sites of the Capitol City, where I had attended graduate school and began my career several years earlier.
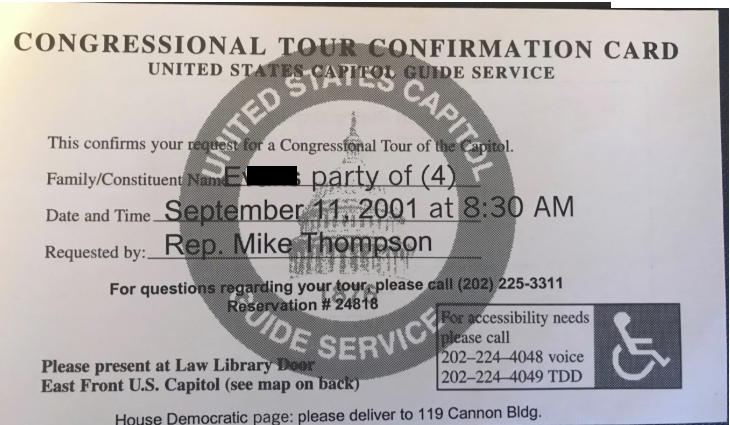
I secured some VIP passes from our congressman for tours of the White House and the U.S. Capitol. The passes came in the mail around mid-August with the date for the Capitol tour scheduled at 8:30 am, September 11, 2001.
Just another day. It was before history changed.
We also planned a trip to New York after the wedding as my girls wanted to visit their birthplace. The oldest specifically requested a trip to the top of the World Trade Center’s (WTC) Windows on the World.
Their last night in New York before moving to California was spent at the Marriott World Trade Center, South Tower.
We booked our flights.
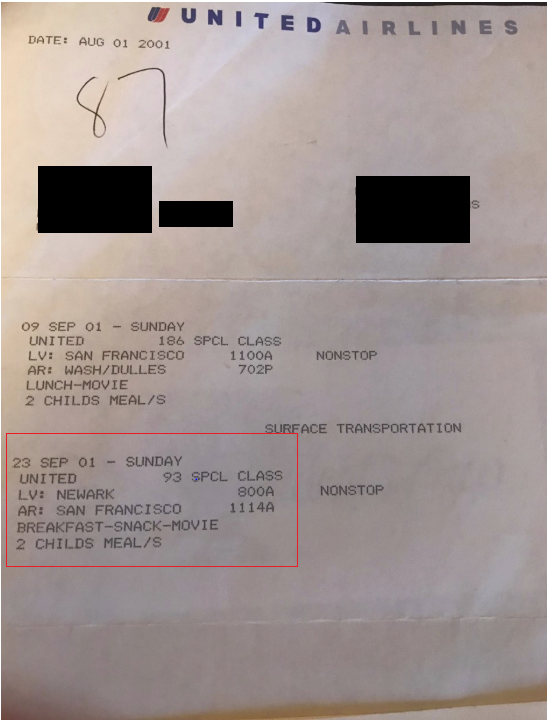
The return flight from New York was familiar. I had flown it at least a hundred times — United Flight #93, Newark to San Francisco.
Just another routine United flight. It was before history changed.
Washington, D.C.
We arrived at Dulles airport on Sunday night, September 9th, and it felt good to be back in Washington.
As we were disembarking, my 3-year-old noticed the overhead air blowers were still on and blowing hard. She shouted at me, “dad, they are wasting energy.”
The plane burst out in laughter. California was in the middle of an energy crisis and experiencing brownouts on a daily basis throughout that summer.
September 10, 2001
The following morning we had some downtime, and because the White House was only a few blocks from our Georgetown hotel, I took the girls down to see the president’s house. We arrived at the front gate, and I noticed the secret service on top of the White House with high-powered binoculars looking into the sky.
I hadn’t seen this since the day after the U.S. bombed Libya in 1986 in retaliation for Gaddafi’s bombing of a Berlin disco, which killed some American soldiers. I had an interview the next day at the Council of Economic Advisers (CEA) in the Old Executive Office Building. I recalled how tight security was, specifically, the sharpshooters on top of the White House.
Just for context, I hadn’t been in Washington in five years before our September 11, 2001 visit, and, no doubt, security had ramped up considerably. Put away those conspiracy theories.
Video Tape
I began filming the White House on the day before history changed, specifically the secret service with their high-powered eyes trained on the sky above the White House.
I mentioned to my family there must be “some sort of terrorist alert.” My bright, analytical 3-year-old immediately chimed in, “dad, they are trying to hurt the president.”
After thinking another minute, she asked, “dad, do they [the secret service] know we are good guys?” It was somewhat hilarious, at least, at the time. We have it all on tape.
Lafayette Park
It was hot and humid in Washington on September 10, 2011, the day before history changed. I took the family across the street, sat them on a bench in Lafayette Park, and went to fetch them some water from a street vendor.
Before leaving on the water run, I noticed a middle eastern looking man sitting on the bench next to my daughters. He was fiddling with his cell phone and rapidly thumbing through a stack of ATM receipts. I recall some were from Bank of America.
What struck me most was his fidgety and nervous demeanor.
He was casually dressed in nice khaki slacks, an olive-green button-down shirt, and sandal-like full-toed shoes. He smelled of cheap European cologne. I will never forget his face.
During my search for water, for some reason, I had a bad feeling. I began to think the man on the bench fit the profile of a terrorist. I seriously thought about walking back across Pennsylvania Avenue to report the suspicious character to the uniform secret service officers at the White House north gate. I am sure they would have laughed and dismissed me as some kook.
When I got back to the park, the man was gone. I asked my wife, “what happened to the guy sitting on the bench? He reminded me of a terrorist.” True story.
Racial profiling? Do you really think I gave a shit?
I had a strong feeling based on his actions and my experience being so close to the first 1993 bombing of the World Trade Center when I worked on Wall Street.
September 11, 2001
At about 8:00 am, my wife woke us in a panic. We had overslept and needed to hurry to get to the Capitol building.
I knew we wouldn’t make it on time and, reluctantly, put the kibosh on our trip up to the Hill. She and the oldest went down to the lobby to grab some breakfast. My youngest, still suffering from jet lag, was sound asleep.
I was reading the Washington Post when they returned to the room in horror and said to turn on the television as a plane had crashed into the World Trade Center.
For the next few hours, I watched in shock and was on the phone constantly to my friend, the bridegroom, who had a view of the WTC from his Greenwich Village apartment.
When American #77 went into the Pentagon about an hour later, it was only a few minutes before the F-14s buzzed over our Georgetown hotel.
I went outside, saw people hustling up the sidewalk, and noticed the military had come out on the street. A military Humvee stationed at every corner in Georgetown. This doesn’t happen in America.
Get Out Of Washington
I began to fear for the safety of my family and decided it was time to get out of Washington. I told my wife, “if these people have chemical or nuclear weapons, we are smack in the middle of their target.”
As I was going out the door to rent a car, my oldest shouted, “dad, get a purple car.” Yeah, right, I thought.
I arrived at Hertz in Georgetown, and the clerk said I was lucky as there was one car left. They pulled the car up to the office. A purple Volvo!
Charlottesville
On our way to Charlottesville, I was overcome with the incredible grief that all of America was suffering, especially thinking about my friends in the WTC. I felt sick.
It was the end of American exceptionalism. These things just don’t happen in America.
Seeing the American flags draped over the freeway overpasses on our drive to southern Virginia, I thought, as many others did on that day that changed history, this is my generation’s Pearl Harbor.
September 12
The next day at Jefferson’s Monticello, a busload of senior Japanese tourists pulled up to our third president’s home. They were soon smitten with my 3-year-old. She was one helluva of a cute baby with a unique and very friendly persona.
The Japanese tourists asked to take pictures with her. I warmly agreed and thought how surreal, the day after our own Pearl Harbor. Surely some of these people were alive, and on the other side, on December 7, 1941.
It was the first few days of the grave new crisis, and the nation was grieving and in complete shock, just as the Pearl Harbor generation was on that dark December day, which changed history 60 years earlier. And there was my child chumming it up, the pearl in the eyes of these beautiful Japanese seniors, who were once considered the enemy of the “greatest generation” just a little over a half-century prior.
It gave me a glimmer of hope that the country would make it through the dark days.
The Japanese are now one of our closest allies, which could never have happened without forgiveness. No peace without justice, no justice without forgiveness.
Whenever I have a chance and feel it’s safe or not inappropriate, I ask my Japanese friends if they forgive the U.S. for bombing Hiroshima and Nagasaki. I have never received an unequivocal answer. Not once.
It seems the official position is to sweep it under the rug,
In 2007, during Shinzo Abe’s first term as prime minister, Defense Minister Fumio Kyuma referred to the bombing of Hiroshima and Nagasaki as “something that couldn’t be helped.” – LA Times, April 2016
The FBI
Nevertheless, the day after the September 11th attacks, I began to think about that man I encountered in Lafayette Park the day before.
I contacted the FBI to report the incident.
At first, they seemed to mock me. Asking how he was dressed, probably thinking I would reply, “in Arab garb,” such as thobe and a ghutra and egal.
I spoke with the FBI several times after that. They always remained aloof and never provided information.
Enter Bob Woodward
I then contacted the Washington Post’s Bob Woodward, who put me in touch with his research assistant. We had about an ½ hour conversation in which he told me that Al-Qaeda liked to scout their targets just before hitting them.
Was the White House a target?
Several reports specifically identified Capitol Hill and the White House as targets on Sept. 11. One said a bin Laden associate — erroneously — “gave thanks for the explosion in the Congress building.”
A key figure in the bin Laden financing organization called Wafa initially claimed “the White House has been destroyed,” before having to correct himself. – Washington Post, January 28, 2002
I can’t remember if the FBI or Woodward’s guy confirmed that the 9/11 terrorists were emptying their bank accounts just before the attack and transferring the cash back to the UAE.
From September 5 through September 10, 2001, the hijackers consolidated their unused funds and sent them to Hawsawi in the UAE – National Commission on Terrorist Attacks
The ATM receipts were convincing enough, but my suspicions about the man in the park were confirmed when the FBI released the photos of the 9/11 hijackers,
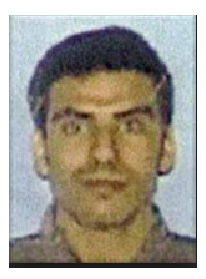
I will never forget that face.
I had sat my daughters down on a park bench across the street from the White House on the day before September 11, 2001, with one of the hijackers. Khalid Al Mihdhar was a senior Al-Qaeda operative who crashed American Airlines Flight #77 into the Pentagon.
How twisted was it that on September 10, 2001, secret service agents were on top of the White House combing the sky for potential terrorists, and one of the Al-Qaeda hijackers was sitting just under their nose, less than 1,000 feet away?
The Wedding
My friends bravely decided not to cancel their wedding the following Sunday, and we participated and shared with them their joy under highly stressful conditions.
The church was located just across the street from Lafayette Park, a stone’s throw from the White House, where presidents-elect traditionally attend their pre-inaugural church service.
During the middle of the wedding, with the country and all of us still nervous and on pins and needles, an army of sirens began to blare. It seemed like it lasted for an hour. Almost certainly, everyone in the church thought another attack might be underway.
I thought the presbyter was going to stop the wedding. We got through it.
Back Home
When the government lifted the ban on air travel, we caught one of the first flights out of Dulles back to the west coast. That was one nervous flight.
One of our flight attendants freaked out when a passenger refused to sit down. I have no doubt our plane was crawling with air marshals.
We Made It
We did get through it. The nation got through it.
The world is much different now.
September 11th was way too close to my family, and we were fortunate to escape the ultimate tragedy.
Not so for many of our friends, fellow Americans, and good citizens from other countries who lost their lives on that day that changed history.
I miss my friends who lost their lives that day.
Please, God, bless their families and all those who lost loved ones, the brave Americans who have made the ultimate sacrifice protecting us, and the many who still work to keep us safe.
Everyone Has A Story
Every person remembers precisely where they were, and what they were doing on the day that changed history.
I have wanted to write this story down for 17 years but just couldn’t do it. Now my children will have it to pass on to their children.
Everyone has a 9/11 story. Write it down. It’s cathartic.

President Biden’s top aide wakes up almost every morning at around 3:30 a.m. in his suburban Maryland home, rolls over in bed and pulls out his iPhone to check a number critical to the fate of the presidency.
The information sought by Biden’s chief of staff is not covert intelligence from a foreign government nor a top-secret national security assessment, but a publicly available tracker on AAA.com — the average national gas price, which updates in the early morning. – Washington Post, November 2022
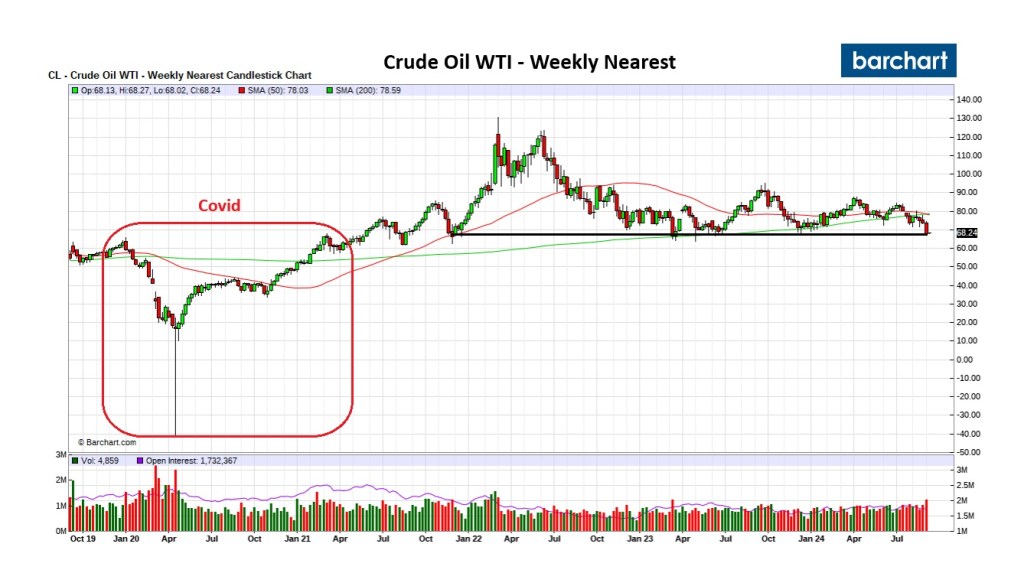
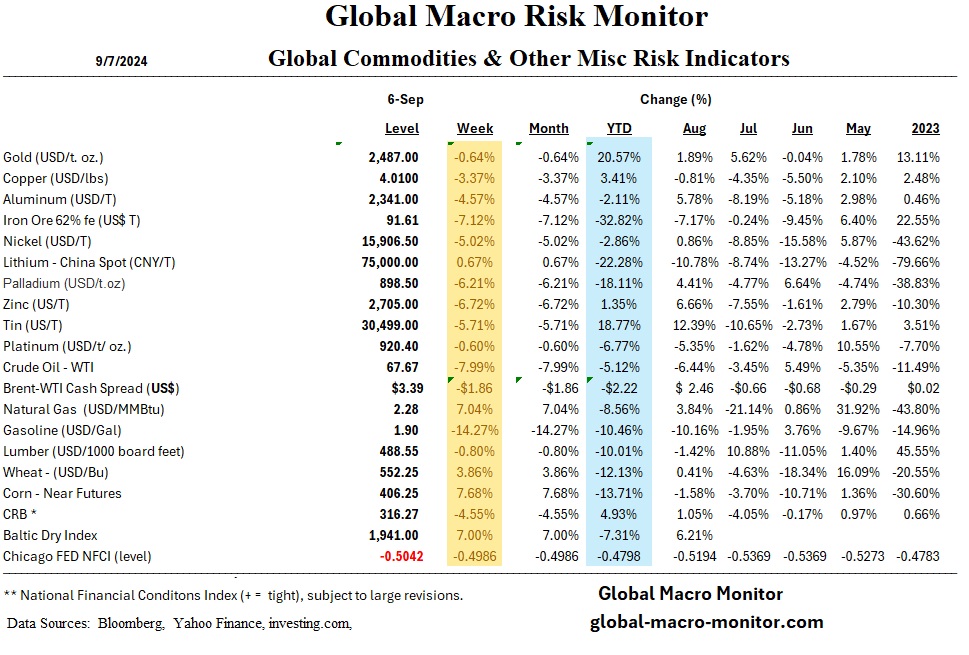
The direction of oil prices over the next eight weeks will heavily influence the upcoming U.S. presidential election as its main derivative, gasoline prices, have an outsized influence on consumer and voter confidence. Gasoline, which represents half of U.S. oil consumption, is a visible and highly sensitive commodity, shaping inflation expectations and directly impacting household finances.
Gasoline futures fell sharply last week, closing at a three-year low on Friday. Gas prices in the futures market are down over 20 percent since the beginning of July. Generally, it takes a few weeks for price changes in RBOB gas futures to show up at the retail pump as distributors and sellers run down their more expensive inventory.
Recent declines in gasoline prices have provided relief to consumers, especially in key battleground states like Arizona and Nevada, where lower prices could benefit the Harris campaign.
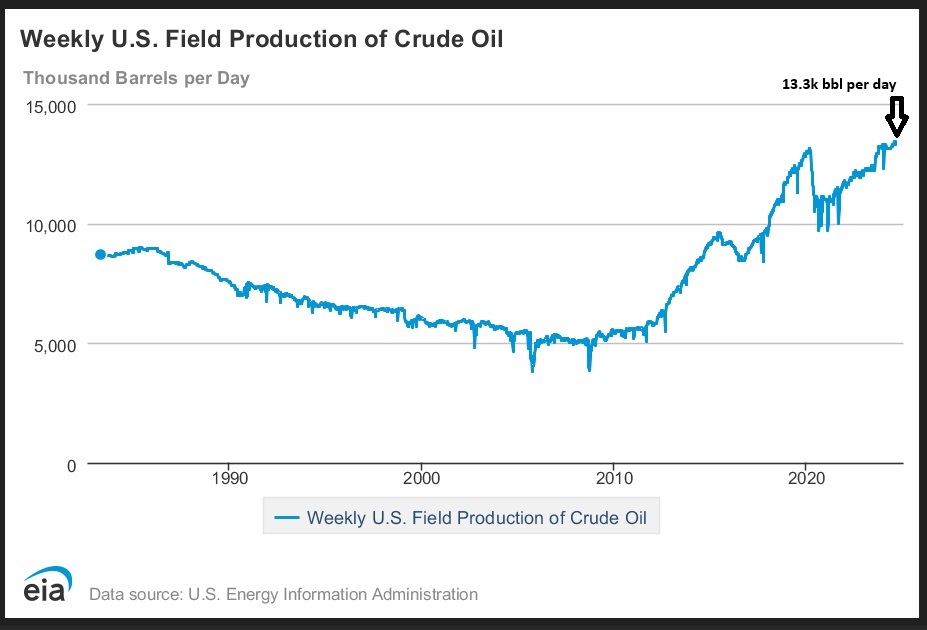
The oil market is so weak that it shrugged off a rescue from OPEC+, who announced on Thursday a delay in future production increases. Oil markets are being affected by slowing Chinese growth, increasing U.S. crude production, and OPEC+’s evolving production strategy.
Stay tuned and strap in for the coming conspiracy theories.
Key Facts: