


-
In economics, things take longer to happen than you think they will, and then they happen faster than you thought they could.
-
Join 1,200 other subscribers
Contribute To GMM

Categories
- 3D Printing
- Agriculture
- AI
- Algos
- Apple
- Automation
- Banking
- BFTP
- Bitcoin
- Black Swan Watch
- Bonds
- Brazil
- Brexit
- BRICs
- Budget Deficit
- Capital Flows
- Cartoon of the Day
- Cashless Society
- Chart of the Day
- Charts
- China
- Clean Tech
- Climate Change
- Coach C
- Commodities
- Coronavirus
- COVID
- Credit
- Crude Oil
- Currency
- Cyprus
- Daily Risk Monitor
- Day In History
- Debt
- Demographics
- Disinflaton
- Dollar
- Earnings
- ECB
- Economics
- Economist
- Egypt
- Electric Vehicles
- Emerging Markets
- Employment
- Energy
- Environment
- Equities
- Equity
- Euro
- Eurozone Sovereign Spreads
- Exchange Rates
- Fed
- Finance and the Good Society
- FinTech
- Fiscal Cliff Monitor
- Fiscal Policy
- Food Prices
- France
- Futurist
- Game Theory
- General Interest
- Geopolitical
- Geopolitics
- German Bund
- Germany
- Global Macro Watch
- Global Reset
- Global Risk Monitor
- Global Stock Performance
- Global Trend Indicators
- Gold
- Greece
- Healthcare
- Heat Map
- Hedge Funds
- Housing
- Human Interest
- Immigration
- Impeachment
- India
- Inequality
- Inflation/Deflation
- Infographics
- Innovation
- Institutional Investors
- Interest Rate Monitor
- Interest Rates
- Interviews
- Italian Yields
- Italy
- Japan
- Jobs
- Lectures
- Macro Notes from Conference Calls
- Manufacturing
- Masters
- Mexico
- Monetary Policy
- Movies
- Muni Bonds
- Muni Market
- Natural Gas
- News
- Nonlinear Thinking
- North Korea
- Overbought Markets
- Picture of the Day
- PIIGS
- PMIs
- Policy
- Politics
- Population
- Populism
- Poverty
- President Trump
- Qunat Strategies
- Quote of the Day
- Quotes
- Rare Earth Elements
- Readership
- Reads
- Real Estate
- Relative Strength Index
- Robert Shiller
- RSIs
- S&P500
- Sector ETF Peformance
- Semiconductor prices
- Semiconductors
- Social Media
- Socialism
- Song for the Week
- Sovereign Debt
- Sovereign Risk
- Spain
- Sports
- State and Local Government
- Tail Risk
- Technical Analysis
- Technology
- The Big Reset
- The Weekend Read
- This Day In Financial History
- Trade War
- Trades
- Tweet of the Day
- Ugly Chart Contest
- Uncategorized
- US Releases
- Video
- Volatility
- Wages
- Week Ahead
- Week in Review
- Weekend Reads
- Weekly Eurozone Watch
- Whales
-
Recent Posts
Meta
Cup & Handle Patterns Everywhere!
Humans love patterns. Sometimes that’s helpful, but other times… Not so much. Apophenia is the common tendency to detect patterns that do not exist. Also known as “patternicity”, apophenia occurs when we try to make predictions, or seek answers, based on unrelated events. – nesslabs.com

Posted in Uncategorized
Leave a comment
Men At Work? Not So Much…
“I come from a land down underWhere beer does flow and men chunderCan’t you hear, can’t you hear the thunder?You better run, you better take cover, yeah” – Men At Work
Posted in Uncategorized
Leave a comment
The Politics of Eggflation
Data has indicated that egg lovers in the US have been subject to big swings in the price in recent years…producers in the US are also grappling with regulations restricting the sale of eggs between states.The price of a packet of a dozen eggs peaked at $4.82 in January 2023, as global feed prices spiked in the wake Russia’s invasion of Ukraine. Yet within months they had halved. By August this year they reached $3.02.
The fluctuations drew criticism from Republican vice-presidential candidate JD Vance in the swing state of Pennsylvania this month as he blamed Kamala Harris, the Democrat presidential candidate, for egg price inflation. – FT
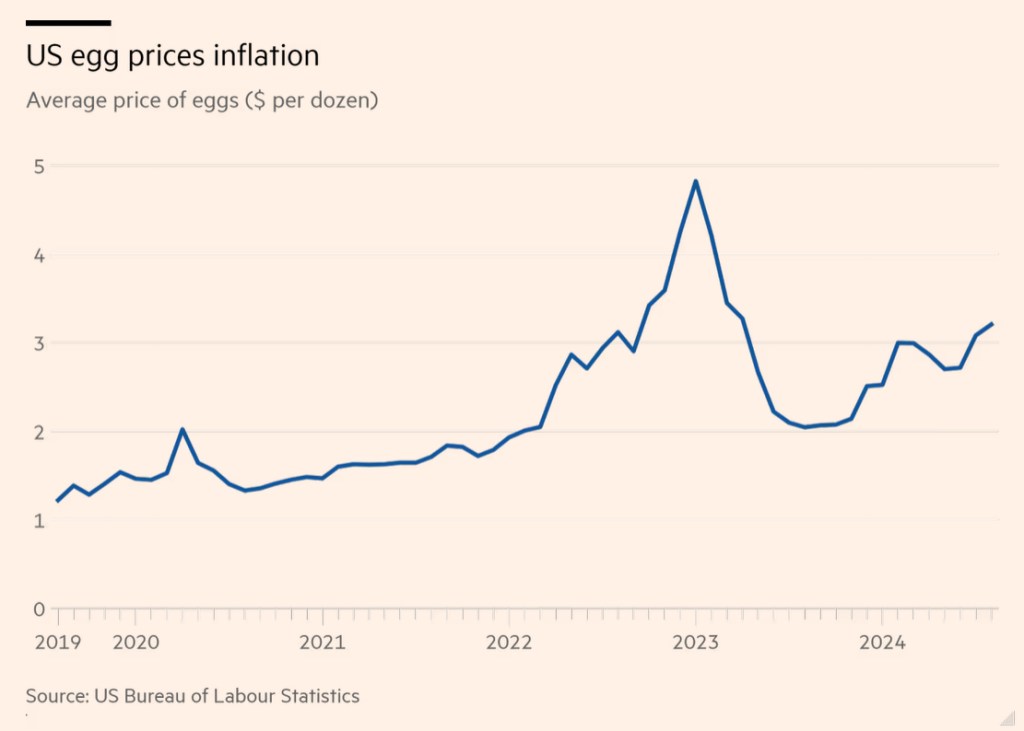
Chart Source: FT
Posted in Uncategorized
Leave a comment
Swing State Economic Outperformance
Key Points:
- Six of seven key battleground states outpaced national GDP growth in Q2 2024.
- Michigan and Wisconsin were among the top 10 fastest-growing states.
- Pennsylvania rebounded after contracting in Q1.
- Arizona, Georgia, and North Carolina saw higher-than-average growth.
- Nevada’s growth lagged at 1.8%, below the 3% national average.
- Harris is narrowing the gap with Trump on economic issues.
- A Bloomberg/Morning Consult poll shows Harris tied with Trump on everyday costs.
- Harris has an 11-point lead on middle-class welfare.
- Manufacturing and construction drove growth in several states.
- High prices for essentials continue to concern voters.
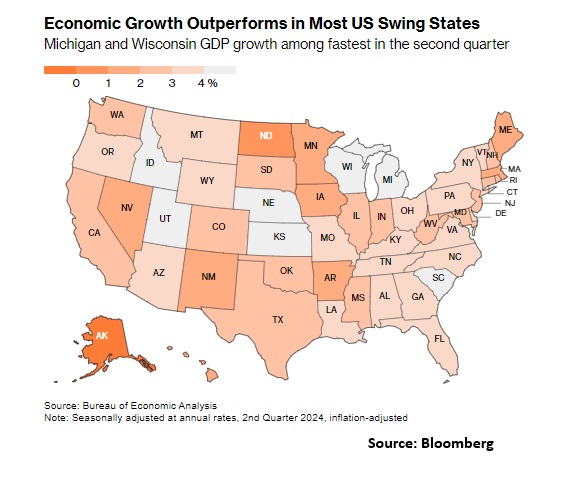
Six of the seven key battleground states in the upcoming U.S. presidential election registered economic growth faster than the national average in the second quarter. Michigan, Wisconsin, and Pennsylvania, which have been slower to recover post-pandemic, experienced a strong economic resurgence. Michigan and Wisconsin were among the top 10 fastest-growing states, and Pennsylvania rebounded after a contraction in the first quarter. The economic momentum in the swing states provides a political boost for Vice President Kamala Harris, who has been narrowing the gap with Donald Trump on economic issues in recent polls.

The “Sunbelt” battleground states—Arizona, Georgia, and North Carolina—also recorded growth above the national average. Nevada was the outlier where growth lagged, primarily due to challenges in its accommodation and food services sectors that are vital to the state’s economy.
Voters have consistently ranked the economy as their top concern, with Trump leading Harris on the issue in most polls. Harris is catching up, however, particularly on matters related to the cost of living and middle-class welfare. A recent Bloomberg/Morning Consult poll shows that Harris is nearly tied with Trump on handling everyday costs and holds an 11-point lead in helping the middle class.
A big caveat is that despite these positive trends, many Americans still feel economic pressure due to high prices, even as inflation slows. GDP growth doesn’t always translate to votes, as voters’ concerns remain focused on the tangible costs they face.
Source: Bloomberg

Posted in Uncategorized
Tagged Donald Trump, Joe Biden, kamala-harris, News, Politics
Leave a comment
