Source: VisualCapitalist
We are reposting a piece as the Fall Classic begins tonight.
Ahh, the Fall Classic!
We’re not talking about October stock market corrections but the World Series! The Boston Red Sox and Los Angeles Dodgers square off tonight to begin the 114th October Classic.
The last time the two teams met was in 1916 when the Dodgers were test driving a new nickname, the “Robins.” The Red Sox beat Brooklyn four games to one. Casey Stengel starred for the Robins, and Babe Ruth pitched thirteen shutout innings after giving up a run in the first inning to win the fourteen-inning game two. The winning players share (World Series bonus) was $3,910 ($87,500 in 2018 dollars) versus the last year’s Astros’ player share of $438,901.
Mr. October
No baseball player is more synonymous with the World Series than Mr. October himself, Reggie Jackson.
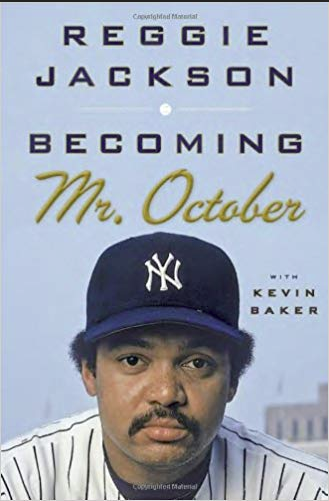
Jackson earned the nickname “Mr. October” with his performance in Game 6 of the 1977 World Series against the Los Angeles Dodgers. Down 3-2 in the fourth inning, the Yankees outfielder hit a two-run home run and did the exact same thing in the fifth inning. Then in the eighth, he hit another home run to put the Yankees up 8-3. His performance secured the win and the series for New York.
– Athlon Sports
Reggie and Me
I have truly lived a Walter Mitty life.
The first twenty-five years of my life was baseball, 24/7, an obsession that almost compares to today’s techno-addicted youth.
My baseball career ended due to an injury, but also mainly the lack of emotional maturity and the ability to pull out of an ugly hitting slump. Nothing worse for your confidence than cruising along during the season hitting .350, then to fall into a 2-for-50 tailspin. Then comes the vicious circle thinking you will never get another hit. Ironically, baseball players can fail 70 percent of the time, and still hit .300, making it to the Hall of Fame.
It’s very similar to what happens to your psyche and P&L, trying to trade crude oil and natural gas against the ‘bots. You gotta shake off the bad ones and move on. I could’ve been somebody, damn it!
I did have a headstart in baseball as a young teen working with the Los Angeles Dodgers, first as a batboy, then batting practice pitcher, and adjunct bullpen catcher. Later, I would spend some time with the Atlanta Braves and Oakland A’s.
I caught Tommy John (TJ) — the real one, who had the surgery named for him – for almost the entire season he was out before his remarkable comeback. He could barely extend his hand after the surgery but refused to give up. I would try to hide in the outfield before games but would soon hear Red Adams, the Dodgers pitching coach, calling me to come to the bullpen.
TJ was very wild when he first started on the comeback trail, bouncing curveballs in the dirt, which too often ended up smacking me in the family jewels. It was a painful year, and it’s amazing that I could still have children. Tommy John is one of the greatest human beings ever.
Reggie
One winter or spring during the off-season, can’t recall, I get a call from my boss to come to Dodger Stadium for a few days as Reggie Jackson was going to film a television commercial. He said the production company might need a pitcher or catcher and I should be around to help Reggie around the clubhouse and stadium.
I wasn’t in the union so being in the commercial was out.
Over the next three days, Reggie and I became very close. He treated me like I was his little brother. Reggie had this larger than life image, with a reputation for a larger than life ego.
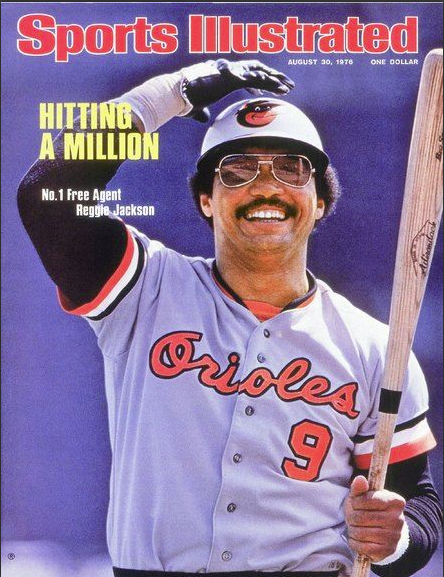
…it all flows from me. I’m the straw that stirs the drink – Reggie Jackson, Sports Illustrated, May 1977
He took a lot of heat for that quote, and still denies it, and I certainly didn’t see the Reggie ego the media often portrayed. He was super kind, friendly, down to earth, always made time for you, and was just a great guy to hang out with. He made you feel comfortable and not conscious you were in the presence of one of baseball’s greatest stars. It was very much like a good day hanging with your big brother.
Self-centered egomaniacs don’t treat the little people like that.
One thing that really stood out over our three days together was how Reggie spoke. He sounded like an university professor, very intelligent, Later I found out he has an IQ of 160, the same as Steven Hawking! That is genius zip code.
Pumas
What really sealed the deal was when Reggie finished filming and was about to leave. He handed me a piece of paper with an address and phone number:
22 Yankee Hill
Oakland, Ca
(415) xxx-xxxx
He said when I was in the Bay Area; I would never stay in a hotel but with him. I believe that house burnt down in the 1991 Oakland Hills fire.
He then asked for my shoe size and address. We shook hands and parted ways.
About a week later five boxes of Puma tennis shoes came in the mail. Thank you, Reggie!
Baltimore Orioles
The next season, the A’s traded Reggie to the Baltimore Orioles as a rental. He was playing out his option and Charles Finley, the A’s owner, would never pay Reggie’s new market rate.
My little brother idolized Reggie, so when the O’s were in town, I took him to a game. After the game, I went down to the dugout to say hi as Reggie trotted in from the outfield. He invited me into the clubhouse. I asked Reg if my little brother could accompany me. He said absolutely.
I had told Reggie about my brother, and when we get into the clubhouse, he points to his locker and says, “Geoff, anything, take anything you want. My uniform, glove, anything.” Big egos and the self-absorbed don’t treat little people like this.
I love Reggie Jackson.
Pete Rose
Pete Rose was the same way, by the way. Always thinking and caring about the little guy.
The commish of baseball, Bart Giamatti, my favorite actor’s father, died just eight days after banishing Charlie Hustle from baseball. Just sayin’.
Let’s play ball. Dodgers in six.
QOTD = Quote of the Day
Ms. Harris is processing Cheddar like a Wisconsin cheese factory. – James Carville
Weekly Summary
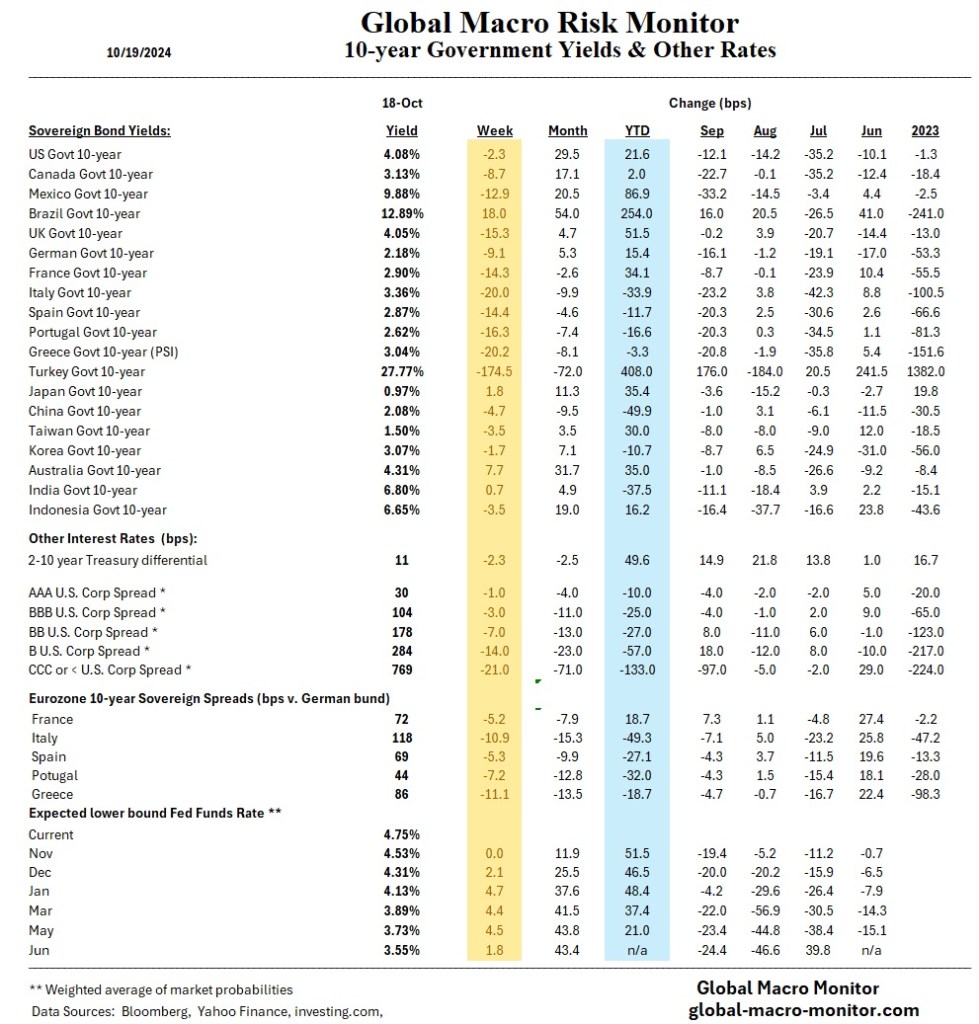
Big rally in Eurozone bond markets as the European Central Bank (ECB) reduced its key interest rate to 3.25%, marking its third 25 basis point cut this year. The decision reflects the ECB’s focus on lowering inflation risks and addressing a weaker growth outlook. The Governing Council stated that disinflation is progressing, with euro area inflation easing to 1.8% in September, below the 2% target for the first time in three years.
Key challenges persist for the euro zone, including manufacturing weakness in Germany and fiscal consolidation in France. The ECB lowered its 2024 GDP growth forecast to 0.8%, reflecting subdued domestic demand. Despite market expectations, the ECB maintains a cautious outlook, indicating December will offer more clarity as data-driven projections continue.
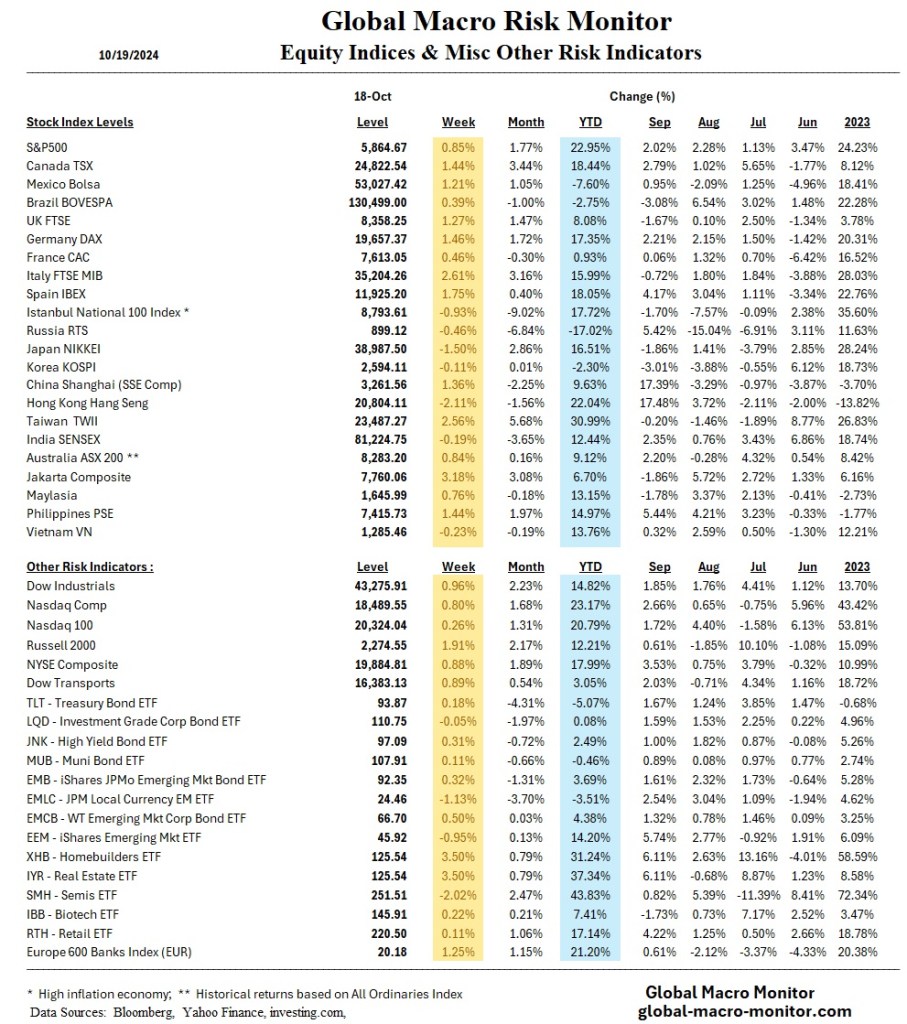

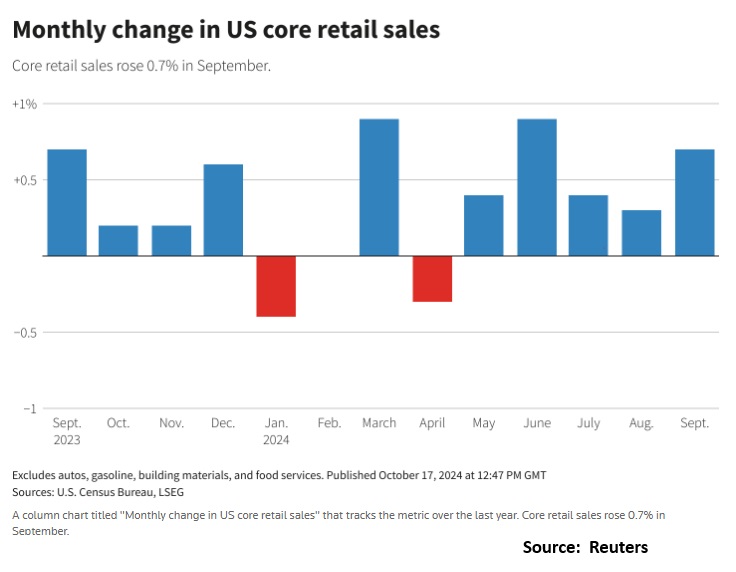
The Census Bureau reported today that U.S. retail sales rose by 0.4% in September, reflecting consumer spending on a wide range of goods and services. Lower gasoline prices freed up more disposable income, leading to increased spending at restaurants, bars, clothing stores, and online retailers. The uptick in retail sales suggests continued strong economic growth, prompting economists to predict a smaller interest rate cut from the Federal Reserve in the coming months. However, concerns remain over inflation, election-related uncertainty, and signs of cautious consumer behavior in some sectors.
Here are a couple of headlines from today. You decide.

Weekly Summary
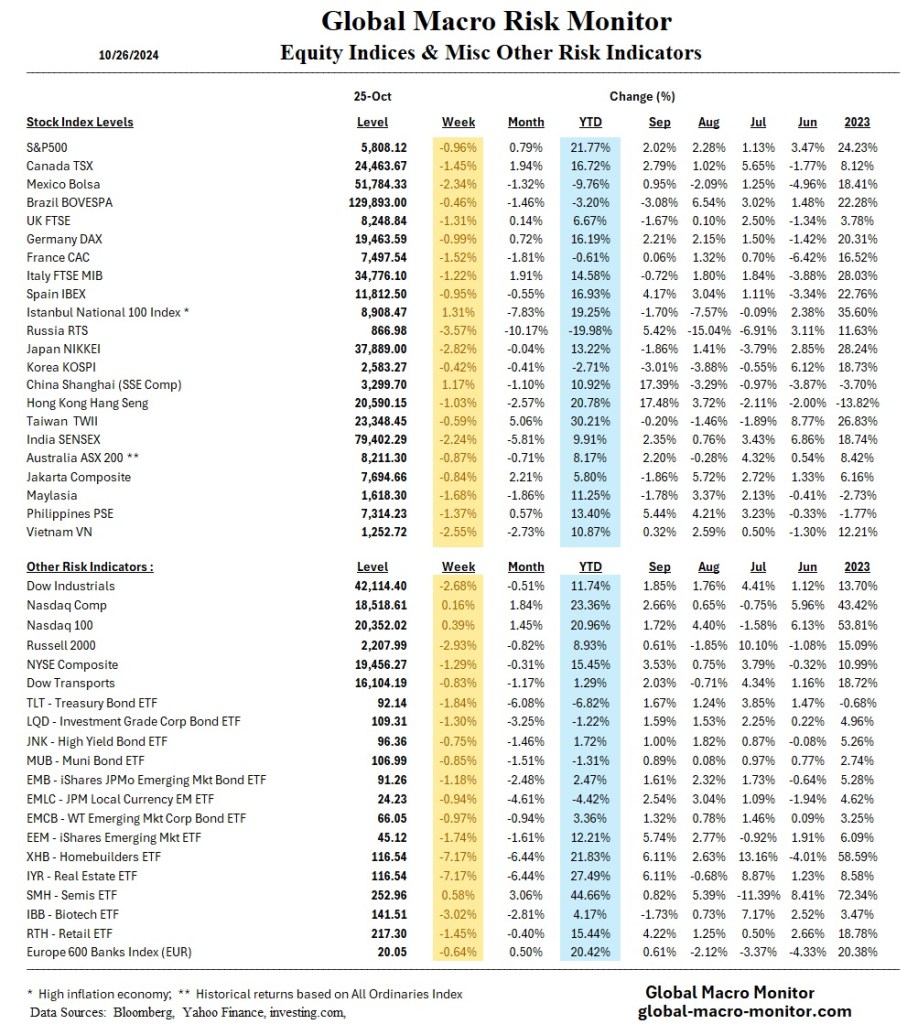
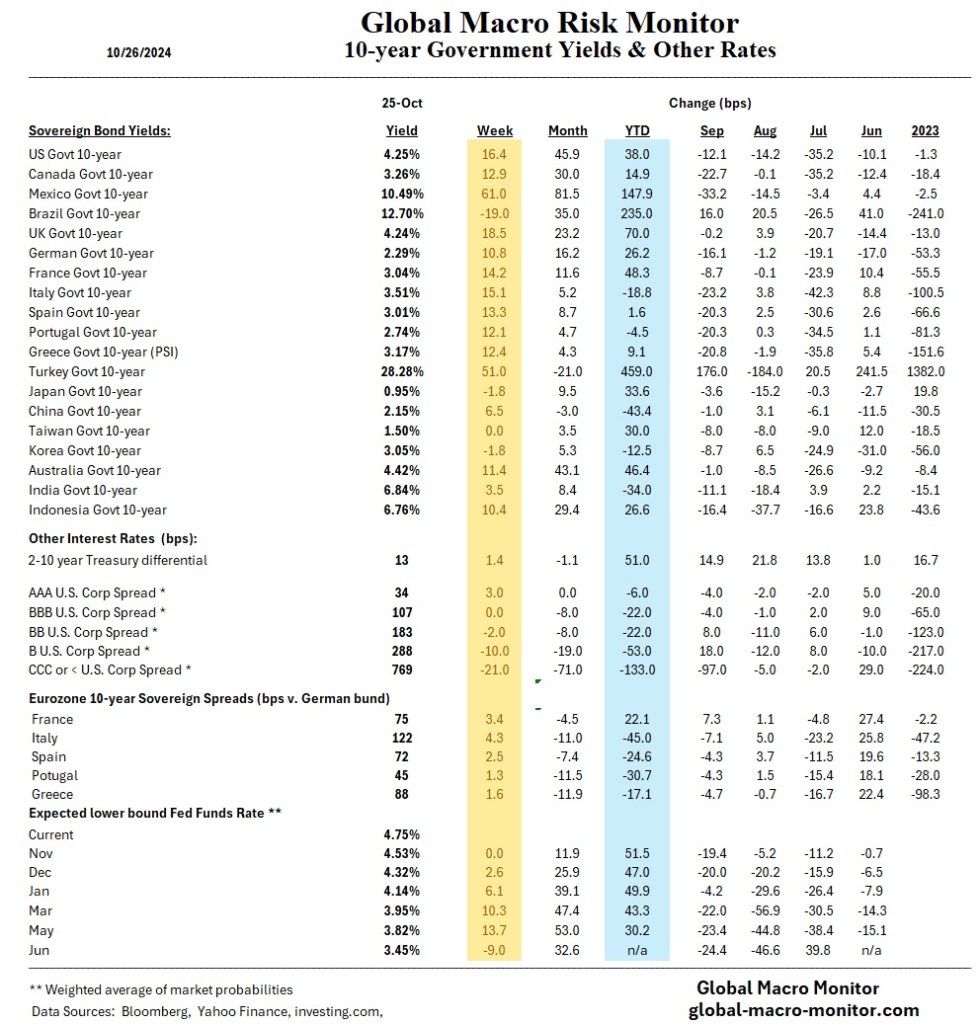
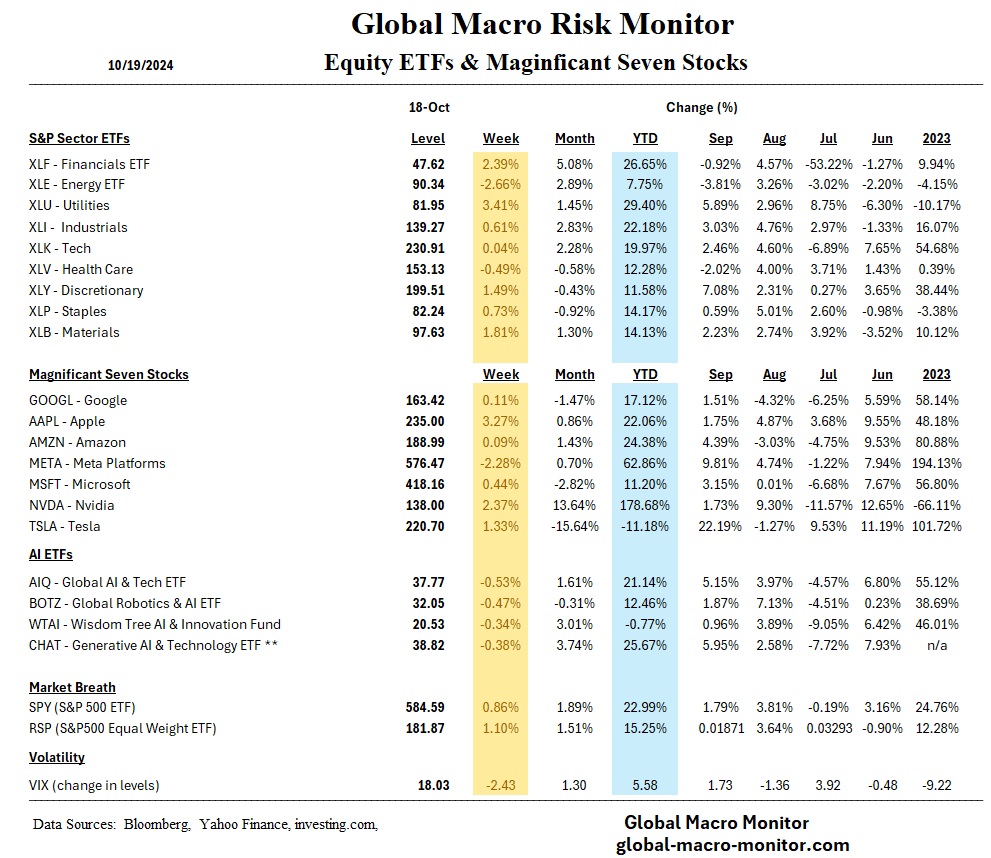
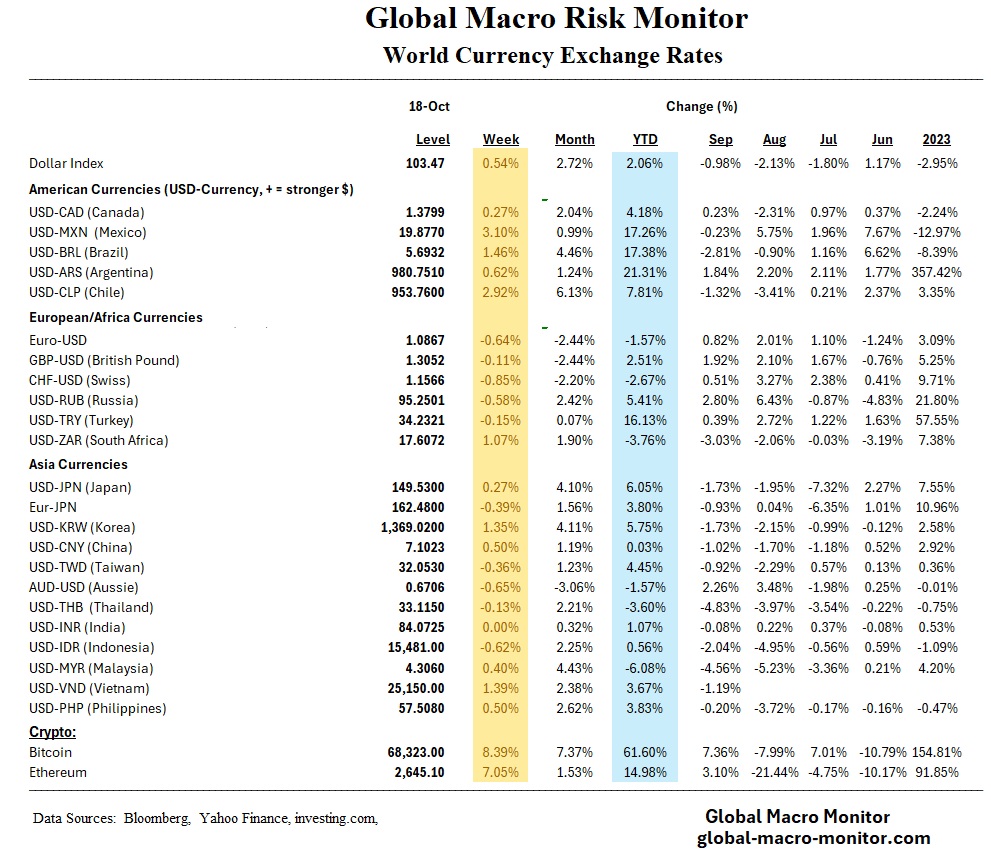
Equities are higher, interest rates are higher, expected Fed funds are higher, credit spreads are in, and the dollar is stronger; ergo market expectations of a stronger economy.


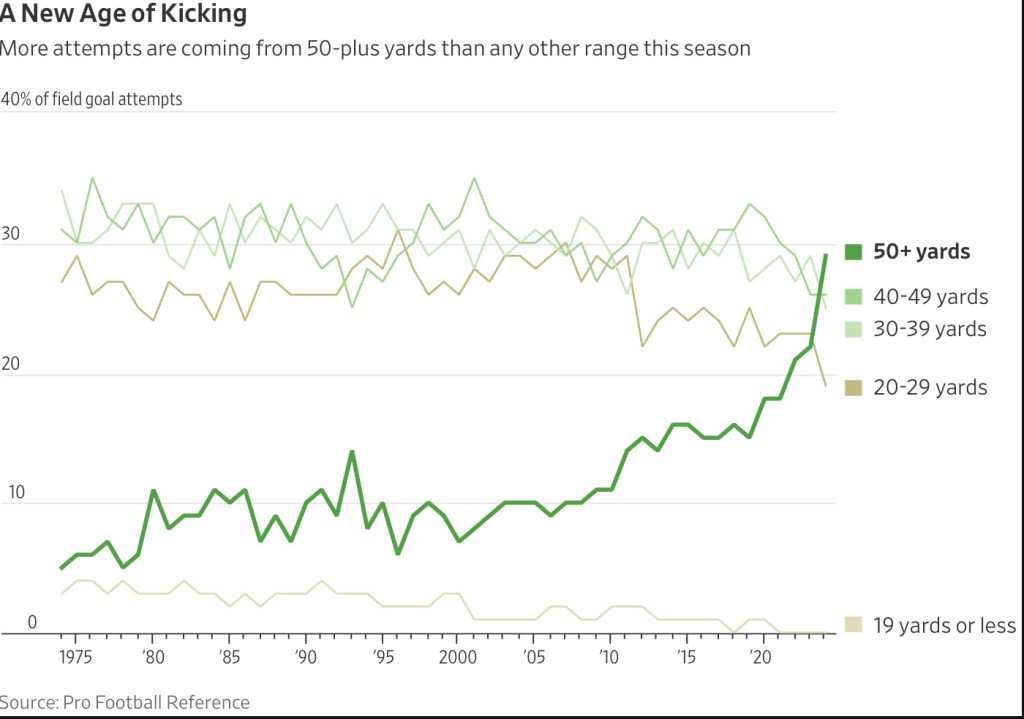
COTD = Chart of the Day
This season, teams are making more field goals per game than ever— even as they’re also hitting them from more far-flung distances. Some 29% of this year’s attempts have been from 50-plus yards, far and away the most in NFL history. At the same time, 76% of those long-distance kicks have gone in, which is easily the highest percentage ever.
Somehow kickers are becoming more accurate and more powerful at the same time. Last week alone, there were 15 tries from at least 50 yards—and 12 of them went in. – WSJ