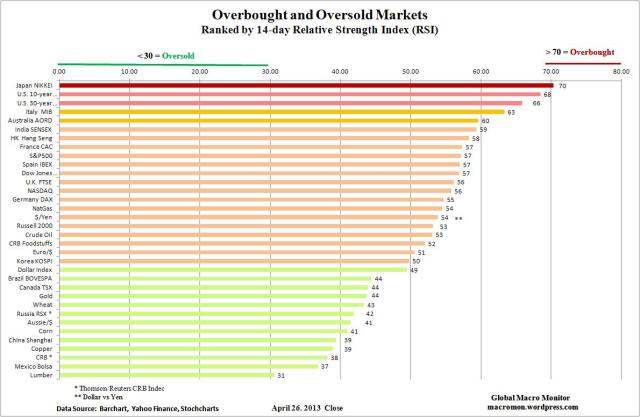
The Relative Strength Index (RSI) is a momentum oscillator that measures the speed and change of price moves. The RSI moves between zero and 100 and is considered overbought with a reading above 70 and oversold when below 30. Note the RSI can sustain an overbought (oversold) reading in a strong up (down) trend.
Click chart to enlarge.
(click here if chart is not observable)


Pingback: Sunday links: dictated by luck - Abnormal Returns | Abnormal Returns
Pingback: “Overbought and Oversold Markets” | Harderblog
I pay a visit everyday a few sites and sites to read articles
or reviews, but this blog offers feature based posts.
Pingback: The Küle Library