
Since CK loved charts, we will honor her with a weekly (consistent as we can) chart series with addition of a few of our comments.
1. Crypto Crash

Rising speculative asset values that are not backed by production are inflationary on the margin as the wealth effect increases demand with no commensurate supply or production. My 19-year-old daughter brags about her friend who bought a new Tesla with his/her crypto winnings. What did he/she produce, we ask? The crypto crash and stock bear market are doing some of the Fed’s work but destroying many true believers’ savings. An example of market-based “money” destruction.
The market capitalisation of crypto has slumped to just $1.3trn, from nearly $3trn in November. On May 18th bitcoin traded at around $29,000, a mere 40% of its all-time high in November; the price of ether, another cryptocurrency, has collapsed just as spectacularly. Six months ago Coinbase, an exchange and the leading crypto-industry stock, was worth $79bn. Now it is valued at just $14bn, and the firm is “reassessing its headcount needs”. – Economist
2. U.S. Labor Force Below Pre-COVID Trend
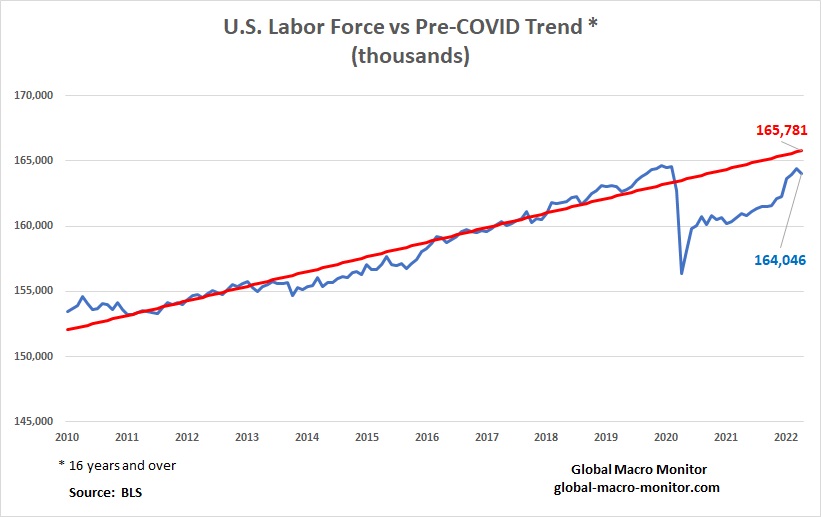
The U.S. labor force is 587K or 0.36 percent below its December 2019 peak and 1.7 million short of its pre-COVID trend. Understanding the economic impact of the post-COVID labor force dynamics cannot be inferred without digging deeper. We have done that and will post it up later this week. Stay tuned.
3. The U.S. Economy Is Almost Back To Its pre-COVID Trend

The U.S. economy is now back to only 0.80 percent below its pre-COVID trend. Compared to the labor force gap, it is not a stretch to understand what’s driving wage inflation.
4. Housing Inflation Still A Big Issue
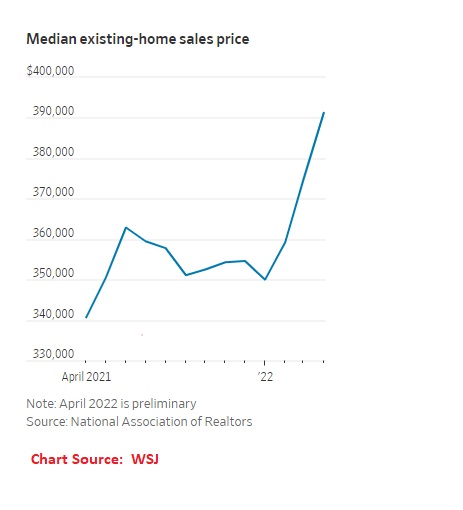 Shelter inflation doesn’t capture the true cost of housing in the way Owners Equivalent Rent (OER) is calculated but is starting to show up in the official figures, now one of the main drivers of CPI inflation. As of today, we are still seeing panic buying and all-cash offers to win the bid for houses in NorCal. That money needs to leave the economy, and it will if the Fed backs up its tough talk. We doubt it.
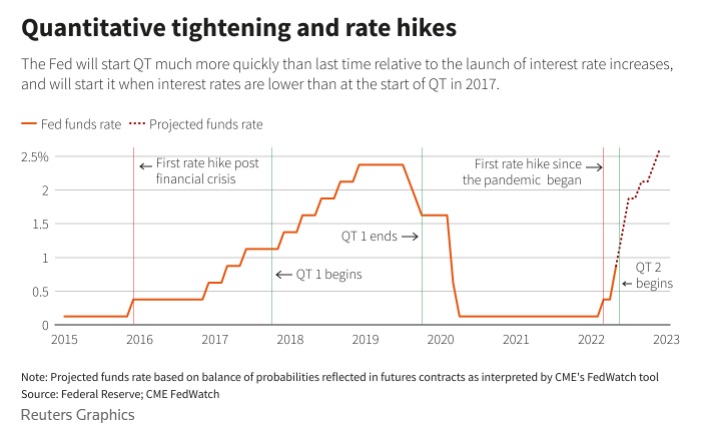
5. Quantitative Tightening Begins Next Week

If the Fed sticks with its quantitative tightening monthly caps – $30 million from June to September and $60 billion after that — we estimate $329 billion will be pulled out of the Treasury market in 2022 and a total of $972 billion through 2023. Estimating the roll-off of mortgages is more complicated and beyond our pay grade, but we can confidently say that the monthly mortgage roll-off cap will be $35 billion after September.
6. The China Syndrome
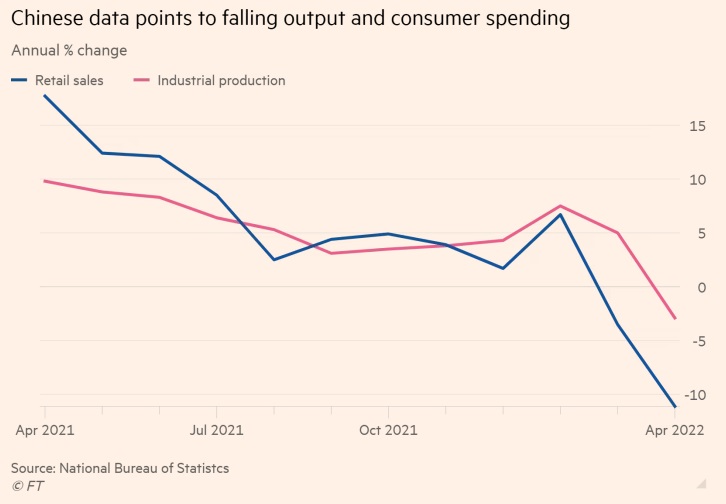
China is the big economy that most economists are worried about and the past week has seen new data reinforcing concerns about its prospects. Accounting for 19 per cent of the world’s total output, China is now so large that when it catches Covid the rest of the world cannot ignore its pain, especially because of its impact on global supply chains and its demand for goods and services from other countries. – FT
7. Stock Market Valuation: Are We There Yet?
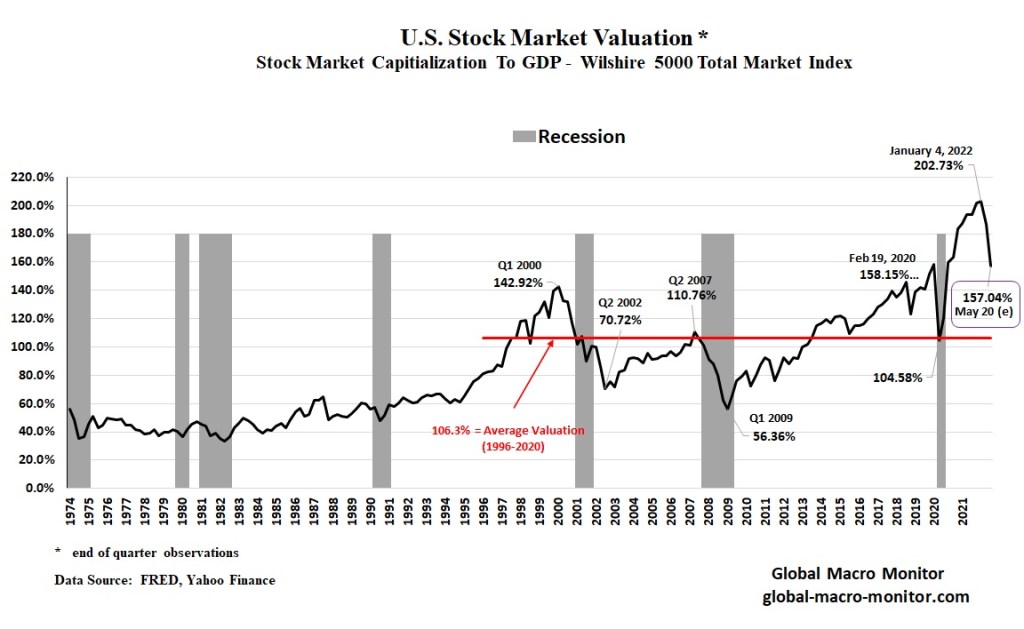
You decide. Inflation is helping a lot.

Please comment or email if you like to see the charts as a weekly feature or if you have any suggestions to make the post better. Thank you.


Thanks for the charts—I vote to make them a weekly feature. Thanks.
I am all for the graphics!
Thanks much!