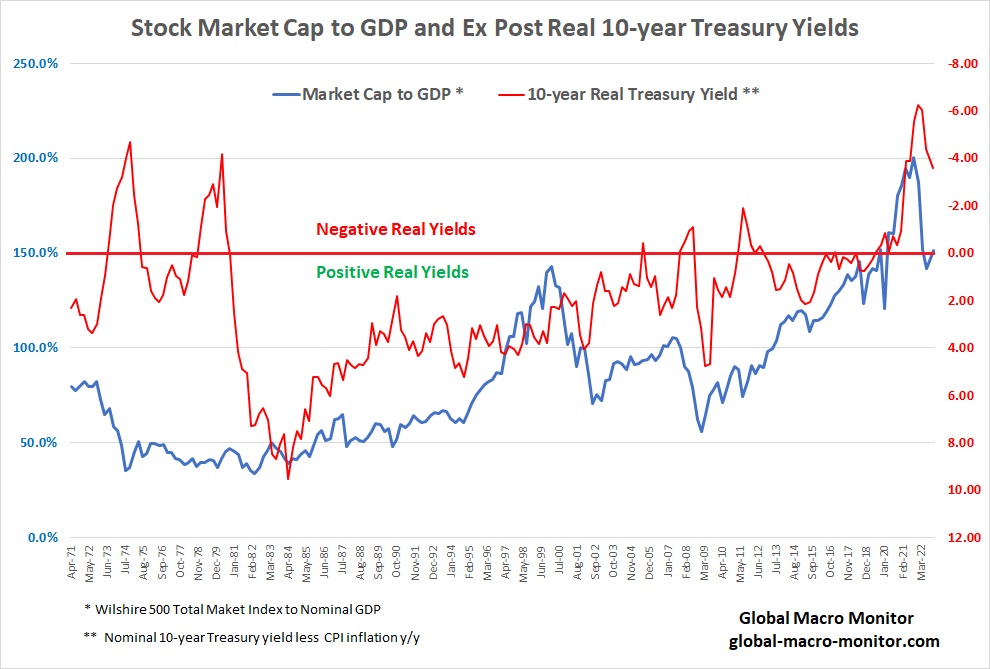
The following chart illustrates an excellent heuristic and simple (if not too simplistic) illustration of longer-term stock market valuation moves. Note how the stock market’s capitalization has significantly outpaced nominal GDP — never sustainable — since the nadir of the Great Financial Crisis (GFC). In contrast, the ex-post real 10-year Treasury yield has fallen from 4.76 percent at the end of Q1 2009 to -6.24 percent at the end of Q1 2022.
Simple Upshot?
Stocks love ex-post negative 10-year nominal yields, where the inflation expectation component misses realized inflation in a big way. This model suggests if you’re betting on a new stock bull market beginning sometime soon, you’re also betting on the recent move in real yields to the upside to reverse and turn more negative. That is a bet on several issues, including how distorted the bond markets are, the credibility of the Fed, the Treasury holdings of foreign central banks, and the path of inflation, among others.