Does the Stock Market Leap On Leap Days?

If the stock market is defined as the S&P500, the answer is: “On average, no.”   

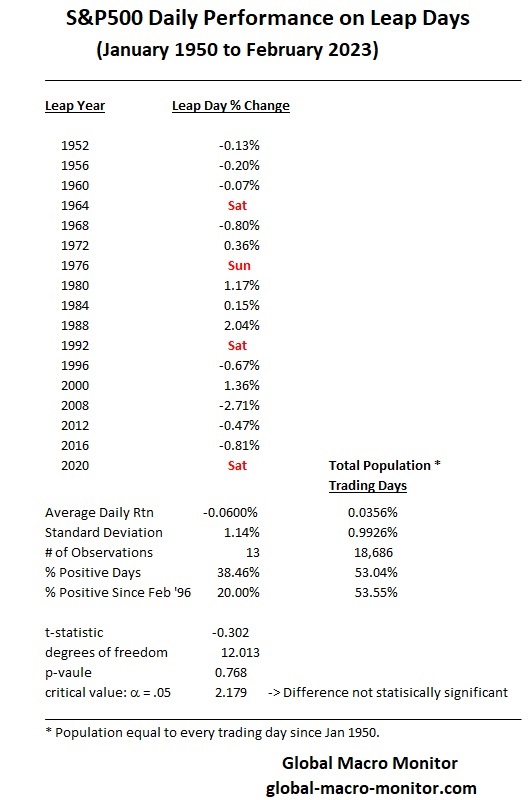
The following table illustrates that of the 13 leap trading days (February 29) since 1950, when the markets were open,  the average leap day return is -0.06 percent versus 0.0356 percent for the total population of 18,686 trading days. 

Only 5 of the 13 leap days (38 percent)  have generated positive returns versus 53 percent for all trading days since 1950.  Four of the past five leap days (2020 fell on a Saturday)  have seen negative returns, with the last three consecutive leap days in the red. 

Statistically Meaningful?

Is the return differential meaningful?  Statisticians would say no.

Based on the results of our two-tailed t-test, there is insufficient evidence to conclude that a significant difference exists in the mean value between leap year returns.  

The t-statistic of -0.302 indicates the direction and magnitude of the difference between the average returns,  relative to the variation observed within the groups. However, the p-value of 0.768 falls short of the critical value at the 0.05 alpha level  (95% confidence level) of 2.179, suggesting the hypothesis that the two means are not statistically different cannot be rejected. This implies that the observed difference in means between leap returns and all trading day returns is not statistically significant.

The significant disparity in sample sizes statistically swamps any of the signals one might gain from the differences in the data. 

Traders Are Not Academics

Nevertheless,  traders and algorithms are not academic statisticians. They look for patterns and run with them.  In fact, it’s about time we get used to the fact that the new AI models, especially the LLMs, derive their logic from empirical observations, i.e., more data and patterns in the data,  and less on traditional logic. 

Place your leap day bets. 

Posted in Uncategorized | Leave a comment

A Presidential Election Arbitrage?

We have noticed an interesting anomaly with respect to the U.S. Presidential election in the political betting markets over at PredictIt.org. We’ve been trading on this site since the 2004 election. 

The site is pricing the Democratic Party to win the presidential election at $.54 (think of it as a probability), with the Republican Party priced at $.48.   However, PreditIt has Donald Trump priced at $.46 to win the election with President Biden priced at $.42.

Not So “Risk-Free”  

Doesn’t that present an arbitrage opportunity?   Sell the Democratic Party at $.53 and buy Biden at $.43, banking $.10 no matter the final outcome?  But risk-free?   Not so fast. 

It seems the market is pricing a significant chance of Biden dropping out of the race and being replaced by a stronger candidate with a better chance of beating Trump.  That is so far off the conventional wisdom’s radar it will shock many. 

Nevertheless,  the market is pricing Biden with only a 74 probability of being his party’s nominee versus Trump’s 91 percent.  

If you have strong conviction it will be Biden and Trump on the ballot on election day, do the arbitrage.  Even better, sell all the other candidates,  which could bank you more but at a larger potential loss. 

We heard from a friend this weekend,  ‘There is no way in hell it won’t be Biden and Trump on November 5th.”  We asked if he would like to bet on it.  The response was a resounding no.  That would have been an easy $.30 plus if he bet us straight up, hedging with a buy of both Biden and Trump to win their party nominations.   

Risk-free arbitrage opportunities are rare and include counter-party risk, which many overlook or don’t consider. 

Posted in Uncategorized | 1 Comment

Global Risk Monitor: Week In Review – February 23

Posted in Uncategorized | Leave a comment

20 Emerging Technologies That Will Change Everything

Posted in Uncategorized | Leave a comment

Global Risk Monitor: Week In Review – February 16

Posted in Uncategorized | Leave a comment

Guam: The Next Global Flashpoint?

Posted in Uncategorized | Leave a comment

COTD: The Bull Market In Satellites

COTD = Chart of the Day

If the idea of tech impresarios sending fleets of satellites into space to revolutionize communications by making high-speed connections available just about everywhere sounds familiar, it should. That’s certainly the news of today, with Elon Musk’s Starlink already girdling the globe with more than 4,000 satellites in low-Earth orbit and rivals including Amazon.com Inc.’s 3,236-satellite Project Kuiper—the brainchild of founder Jeff Bezos—not far behind. – Bloomberg


Posted in Uncategorized | Leave a comment

The Risks of the Magnificant 7

Posted in Uncategorized | Leave a comment

Biden’s Market Probability of Re-election Craters

President Biden’s odds at PredictIt.org of being re-elected in November cratered after the release of last week’s special counsel’s classified documents report.  He was cleared, but the following language in the report inflicted a major political flesh wound, 

“at trial, Mr Biden would likely present himself to a jury, as he did during our interview of him, as a sympathetic, well-meaning, elderly man with a poor memory“. – Special Counsel’s Office

Posted in Uncategorized | 2 Comments

Global Risk Monitor: Week In Review – February 9

We added a Fed tracker at the bottom of the yields page, which measures the change in the expected Fed Funds rate at each upcoming FOMC meeting throughout the rest of the year.  The rate is a weighted average of market probabilities.  Note the significant market revisions this past week in the later months, such as an increase of 63 bps for the December meeting.  Is Mr. Market listening?  


Posted in Uncategorized | Leave a comment