

Don’t let the title scare you off; this is a must-view.
Money Quote (be sure to view the video for context):
Free speech is never freer when it’s hate speech directed at Jews. – Prof Galloway

Click here to view the interview
COTD – Chart of the Day
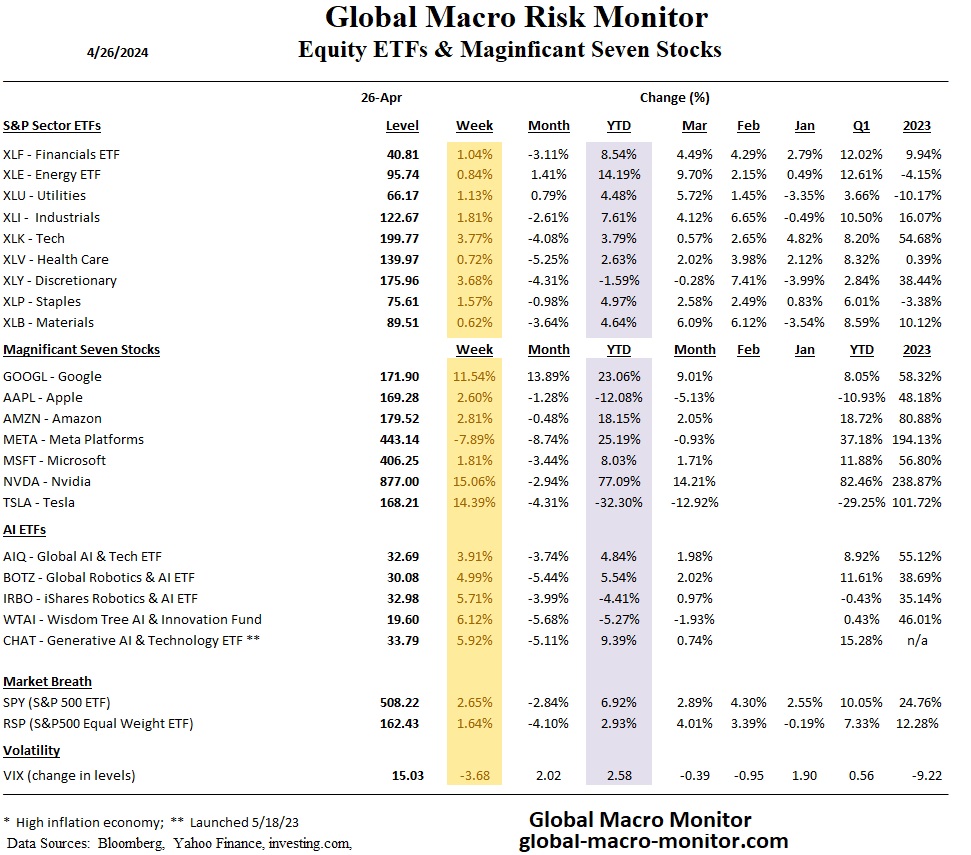
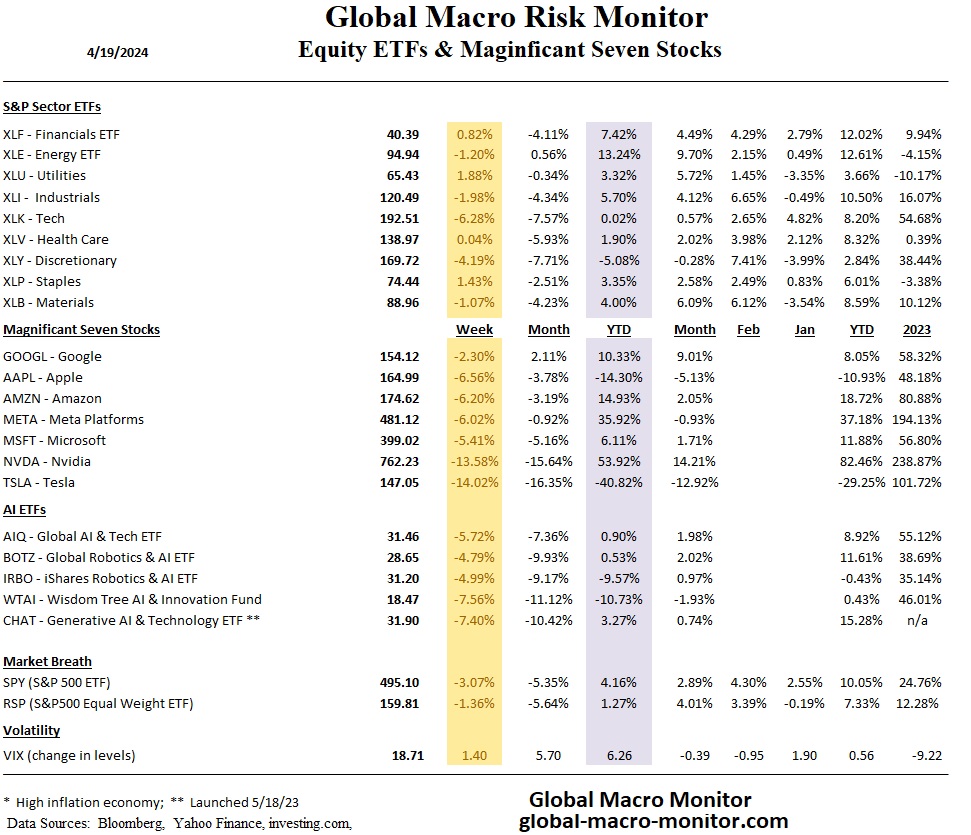
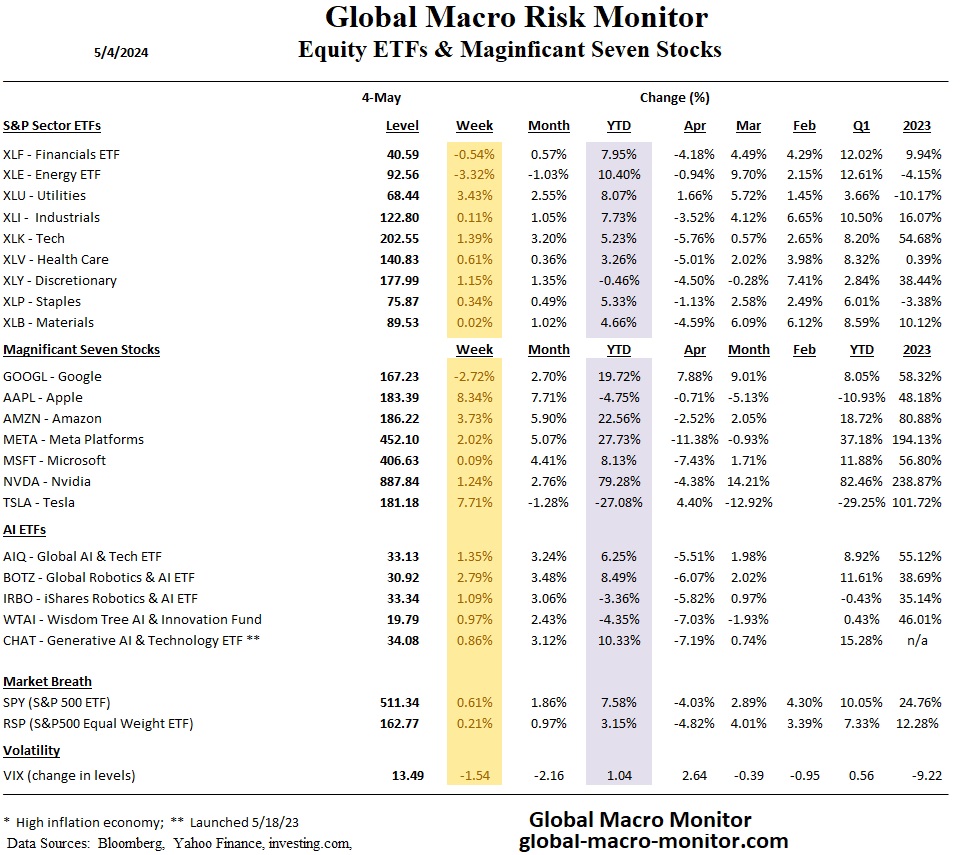
While the cohort of seven megacaps has done well in the last two years because of their superior earnings-per-share growth relative to the broader market, this advantage could decrease in 2024 and even more significantly in 2025, Hackett noted.“The Magnificent Seven are not nearly as powerful as they once were, and this broadening of the market is creating pockets of opportunity for the rest of the S&P 500,” he noted. “We see this as a positive development for investors looking to diversify away from the recent market leaders,” he added. – Bloomberg

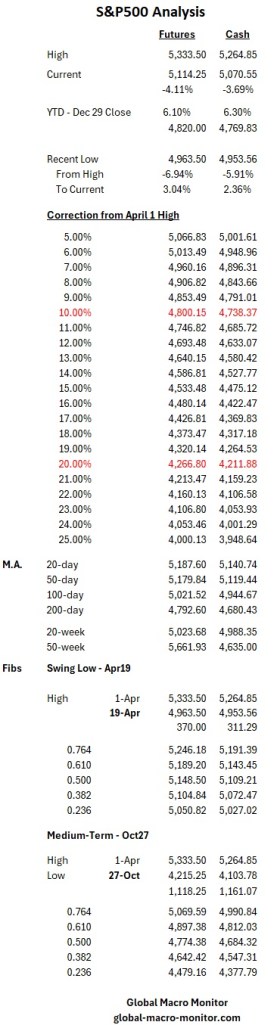
The cash S&P 500 has regained 37.6 percent of its 311.28-point decline from the high on April 1st. The index closed today slightly below a critical 0.382 Fibonacci retracement level. If the futures maintain their bump in after-hours, a reaction to Tesla’s earnings announcement, this level will be taken tomorrow morning.
Nobody knows the future; the best approach for us is to use the analysis of historical data and past levels as a guide to navigate an uncertain and foggy future.
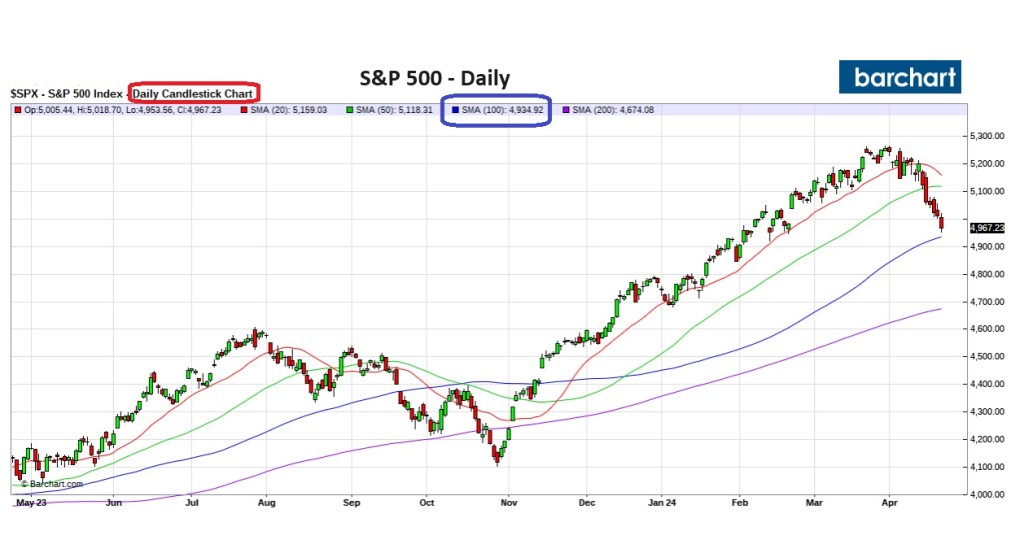
Given the current market narrative of higher for longer, we maintain our view that the S&P 500 is destined for its 200-day moving average of around 4,680.43 before this downdraft concludes. We will reassess if the cash index takes out the .50 Fib level at 5119.44.
Stay frosty, folks.
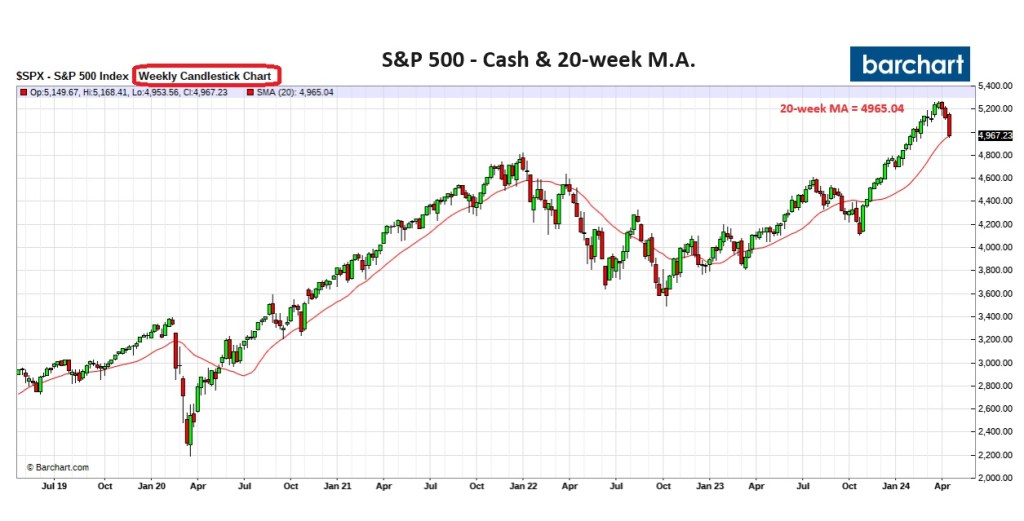
The S&P 500 closed precisely at its 20-week moving average following six consecutive days of declines. It is noteworthy that the index briefly dipped below its 20-week moving average during after-hours trading early on Friday, but rebounded as the Israeli-Iranian conflict began to de-escalate.
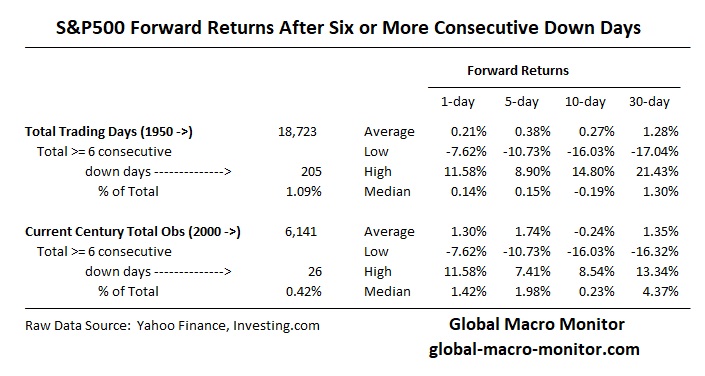
Such prolonged downturns, spanning six or more days, are relatively rare. They have occurred in just 1 percent of the 18,725 trading days since January 1950 and less than 0.5 percent of days since January 2000. The record streak for consecutive down days for the S&P500 is 14, which has occurred twice, in August 1975 and August 1982.
Historically, if the S&P 500 is poised for a rebound, it typically occurs around this point. The table below presents the forward returns following a negative streak of six consecutive days or more.
We do think, or our calculated guess is that the S&P 500 is likely to trend towards its 200-day moving average, currently at approximately 4674, which represents a decline of about 6 percent from last Friday’s close.
Stay frosty, folks.
“Here it comes. Oh my goodness. In your life have you seen anything like that?” — Vern Lundquist, 2005 Masters
The Treasury released the latest budget data last week, indicating a 12-month rolling deficit of $1.7 trillion, equivalent to our estimated 5.86% of GDP.
The deficit-to-GDP ratio is trending positively, showing a decrease in the deficit relative to GDP. This improvement is largely due to budget revenues growing more than twice as fast as expenditures and a continued wind-down of the COVID-19 deficits.
Interest payments on the national debt have increased by over 35% year over year, surpassing the U.S. government’s spending on military programs.
It’s not likely anytime soon the Treasury will hit the 3 percent of GDP deficit levels seen at the end of the Obama administration. Unless, of course, the markets force the issue.
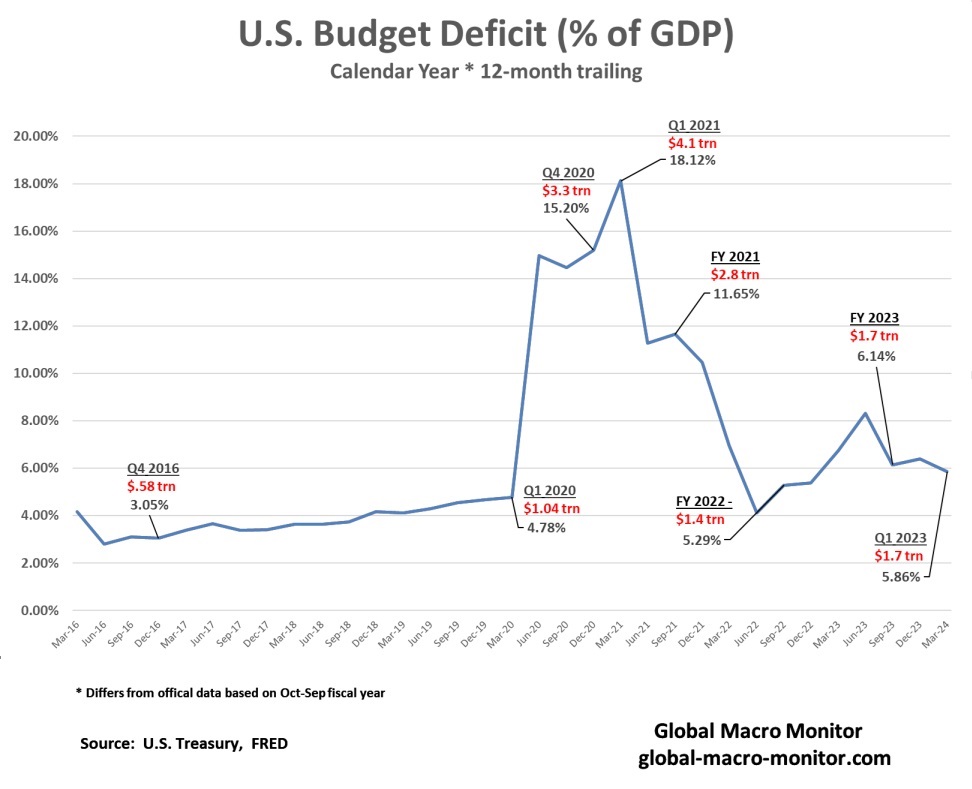
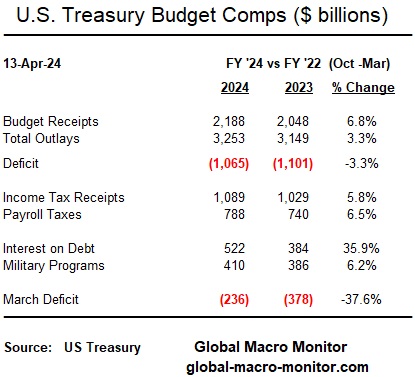
Note, a typo in the above table: FY ‘22 should read FY ‘23.