The New Supply-Side Of Housing & Landlord Nation 2.0

We are reposting a piece we wrote back in ancient days about how this housing bubble, or “everything bubble” would be different from the last (also see here). One major factor why the economy is holding up and not responding to the very aggressive interest hikes by the Fed is that the supply curve for many factors has shifted left.

Housing Supply Curve

This image has an empty alt attribute; its file name is supply-of-homes-1.jpg

Theoretically,  home prices should move inversely with mortgage rates but the lack of supply has ruptured that relationship during the current rodeo.  This, in turn, affects consumption through the wealth effect as home prices remain intact.  It’s amazing in our neck of the woods, a 1200 sq foot home or shack that sold for, say, $400k five years ago is now trading at close to $900k, if you can find one, that is.  That’s an increase of more than 300 percent in the monthly mortgage payment.  Simply stunning.

Note that 66 percent of Americans own their own homes.  As always, we caution about getting lost in the averages.  The home-ownership rate is vastly different among various age cohorts.

We have always maintained an increase in the relative price of housing — faster than wage increases, for example — is an intergenerational transfer of wealth from the young to the old.  The following chart from the Census Bureau reinforces our point, kind of.

This image has an empty alt attribute; its file name is home-ownership-by-age.jpg

Doom Spending? 

If homeowners still think they are millionaires, why not spend, spend, spend ’till daddy takes the T-Bird away?  CNBC refers to it as “doom spending,”

Consumer spending has remained remarkably resilient in the face of some stiff economic headwinds.

Nearly all Americans, 96%, are concerned about the current state of the economy, according to a recent report by Intuit Credit Karma.

Still, more than a quarter are “doom spending,” or spending money despite economic and geopolitical concerns, the report found. – CNBC

Overvalued As It Ever Has Been

The following chart from Bloomberg this morning illustrates how overvalued housing prices — even more so than the 2007 housing bubble.  Eventually, rents will have to catch up, which means mo’ inflation or prices must come down to reality.  The third way is that mortgage rates drop back to 3 percent, which would signal economic doom.  You choose, folks.

This image has an empty alt attribute; its file name is house-prices_rent.jpg

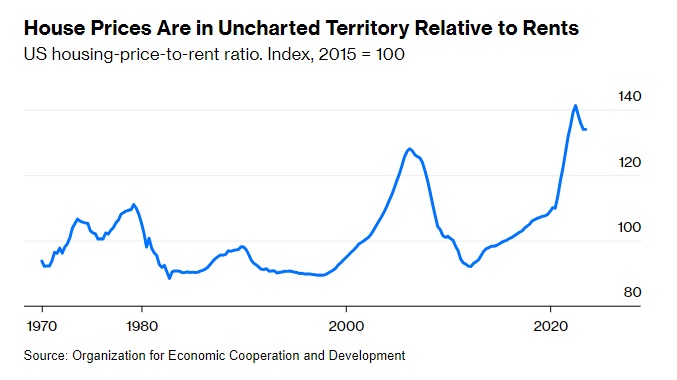
Rents are to house prices what dividends or earnings are to stocks — the flow of income that justifies the value of the asset. When prices and rents get out of kilter, something presumably has to give eventually. As Federal Reserve Board economist Joshua Gallin put it at the June 2005 meeting of the interest-rate-setting Federal Open Market Committee, “rents provide a loose tether for house prices; prices deviate from their long-run relationship with rents for extended periods, but not indefinitely.” About a year and a half after that, US house prices began a five-year, 26% slide, going by the S&P CoreLogic Case-Shiller US National Home Price Index. – Bloomberg

The New Supply-Side Of Housing & Landlord Nation

Originally Posted on  by macromon

David Stockman tweeted the following Zero Hedge chart this morning.

May23_Home Sales

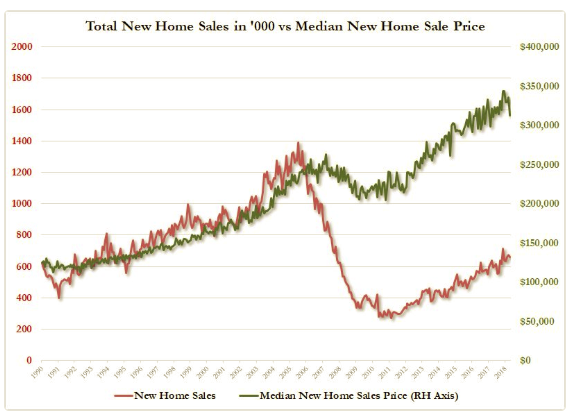
Clearly, a shift in the supply curve for new homes to the left.

OK  – and some buying at irrational prices fueled by artificially low-interest rates and excess money.  The irrational panic buying will take care of itself as interest rates rise and the Fed reduces its balance sheet making money tighter.

This is not the highly leveraged housing market of 2006-07, where even our range boy at the local golf club owned mortgaged three homes, quit his job, and bought an Escalade financed by a home equity loan (true story).   This market is driven primarily by restricted supply and will be more difficult to pop.  The price adjustment will also take place over a much longer period.

The New Supply-Side Economics Is Not Good

We have written how private equity has taken a yuuuge supply of existing homes off the market through their mega 2012-14 bankruptcy purchases, and now rent out the homes to the same people they foreclosed on.  Existing housing is a perfect substitute for new homes.

Rising Costs

The rising costs of building, primarily labor shortages in the construction sector, and restrictive zoning laws are constraining building and the supply of new homes.

The lack of enough skilled workers and a narrow talent pipeline has added extra hurdles, time, and costs to many current projects, according to builders, hindering the current boom time in the industry.

“The number one issue is the cost and availability of labor,” says Randy Strauss, owner of Strauss Construction in Amherst, Ohio, roughly 40 miles east of Cleveland.

The issue is a nationwide one. Contractors in areas such as Houston, which were battered by Hurricane Harvey last year, have struggled to staff up, and the National Association of Home Builders recently found that 82 percent of its members believe the cost and availability of labor are their biggest issues. In 2011, only 13 percent named labor costs as their biggest worry.  — Curbed

The immigration crackdown has played a significant role in the labor shortage in the construction sector.

One study from the National Bureau of Economic Research found that over 1.1 million undocumented immigrants, many of them skilled in essential trades such as framing, work in the construction industry.  –  CITYLAB
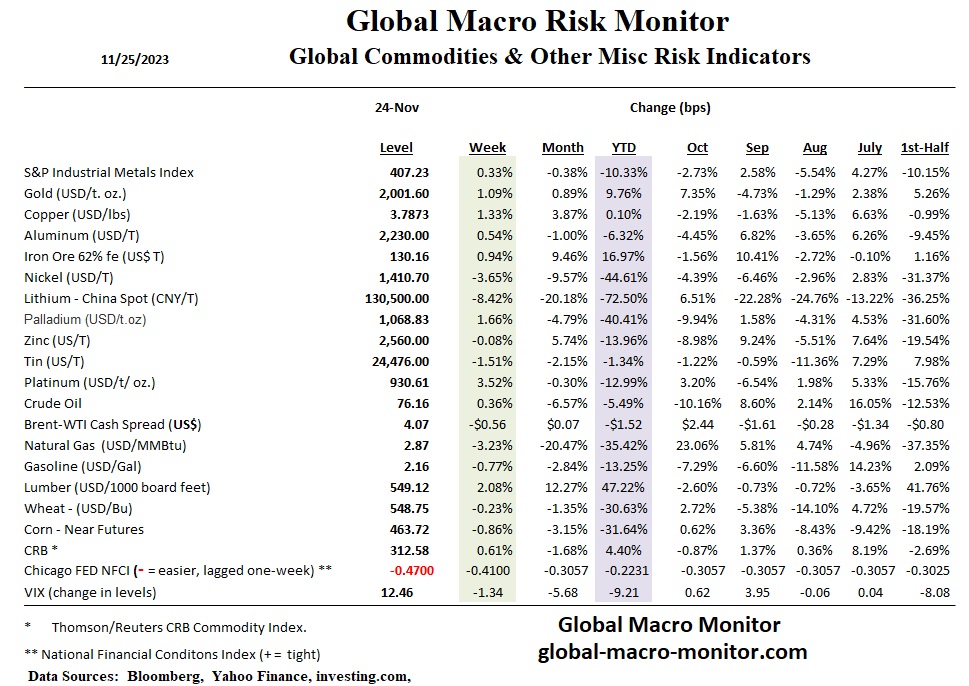
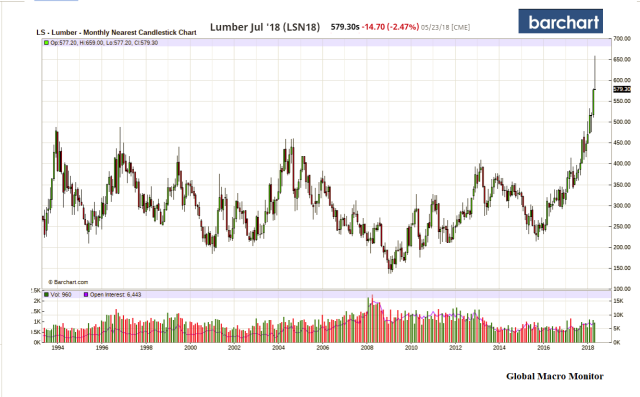
Lumber Prices

The parabolic rise in lumber prices isn’t helping either.  Lumber prices are down over 12 percent from last week’s high, however, with several days of limit down in the futures markets.  Look no further than the long-term lumber price chart to understand what tariffs do to prices and input costs, which ultimately hurt the majority.

Last April, the Trump administration placed a 20.83 percent tariff on Canadian lumber, to the benefit of politically valuable voters in Maine. Within the construction industry, these imports commonly turn into framing lumber, which is used to build single-family homes and small multifamily buildings.
– CITILAB

Bad timing by the administration unless you belong to the small minority of those who make their living in the framing lumber business.

May23_Lumber_Prices

Policy Relief Needed

Shortages are breaking out and are now ubiquitous throughout the economy.

The housing market is one of the hardest hit sectors.  Shortages of new and existing homes; shortages of buildable land, shortages of skilled construction workers.  Inflation is running rampant in the sector.  Yet it hardly registers in the inflation indices because of the way the government measures housing costs.

The new supply-side of housing (shifting the curve left)  is not working for most Americans.  Taking existing homes off the market for rentals or the restriction of new supply through rising input costs, labor shortages, and zoning restrictions are severely reducing affordability and turning the country into a  Landlord Nation.

Since most of the problems are policy-induced, they can be fixed by better and a more comprehensive housing policy.   That is getting back to the old supply-side economics of the Reagan era where the supply curve shifts to the right, illustrated in the simple graph below.  Lower prices with more supply of homes (P 2, Q 2).

Higher prices and lower supply may work for some, but it is certainly not good economics and only adds to an already toxic political environment.

It is time for disruption in housing.

May23_New Supply Side

Posted in Housing, Uncategorized | Tagged , , , , , | Leave a comment

Month In Review: A November To Remember

This month’s price move in the S&P500 ranks as the fourth-best November in the post-war period.  Credit spreads came in quite a bit, and the Chicago Fed’s National Financial Conditions Index eased 20 points, simply stunning.  With such a significant easing, the Fed’s job is more challenging.  However, don’t tell Ms. Market; she is pricing several rate cuts next year.

We now begin the second-best month of the year, on average, for the S&P500, and Ms. Market is certainly not on the side of recessionistas.  Watch credit spreads.

Posted in Uncategorized | Leave a comment

Global Risk Monitor: Week In Review – November 24

Posted in Uncategorized | Leave a comment

Coming Soon: The Best Trading Days Of The Year

“But as any mathematician knows, averages can be deceptive. Andrew Robinson, CEO of famed advertising agency BBDO, once said, “When your head is in a refrigerator and your feet on a burner, the average temperature is okay. I am always cautious about averages.”  — Eric Barker

Since our post, A November To Remember?, the S&P500 continues to rise as one of the best-performing Novembers since 1950, advancing to the 4th best on an average monthly return basis, and it’s only the 21st!  Who would have thunk it?  And that is probably a good reason of this November to remember stellar performance, “nobody thunk it.”

In our years of market watching, we have deduced that short to medium-term stock moves are based on the rate of change, or first derivative, of the factors that drive prices, such as earnings and interest rates.  What drove markets down in the recent bear market was the change in interest rates, and the recent rally has been driven by the change in interest rates, just with a different sign, for example. 

Levels will eventually matter.  Just as the still high level of liquidity central banks injected into the global economy during the pandemic matters, even as the rate of change is negative, is confounding economists, who have been forecasting a recession for the past year. 

The level of interest rates, if the Fed is true to their word, “higher for longer,”  will eventually bite both the markets and the economy. 

There is no doubt markets are hooked on the monetary crack and the financial dopamine created by the anticipation of interest rate cuts and central bank liquidity injections, which drive the market multiples.

Hopes of interest rate cuts spring eternal.  

Best Trading Days of the Year

We have also analyzed the best trading days of the year, with November 24th ranked numero uno — that’s this Black Friday, folks — with December 26th a close second.   Black Friday has fallen on November 24th, about 25 percent of the observations, so all can not be attributed to the urge to splurge on Christmas gifts.  Let’s just say traders tend to get lathered up around the Thanksgiving holiday. 

Twenty-two Standard Deviation Event

The table below also illustrates how one giant outlier, such as the 20 percent plus October 19, 1987, one-day crash, can skew the averages.  

Before Monday, October 19, 1987 (now known as Black Monday), such a massive drop in the market wasn’t considered possible because statistics put such a decline at an impossibly rare twenty-two standard deviation event. How rare is a twenty-two standard deviation event? Writing about the drop in his 2000 book When Genius Failed, reporter Roger Lowenstein of the Wall Street Journal noted, “Economists later figured that, on the basis of the market’s historical volatility, had the market been open every day since the creation of the Universe, the odds would still have been against it falling that much in a single day. In fact, had the life of the Universe been repeated one billion times, such a crash would still have been theoretically ‘unlikely.’”

Yet it happened.  –  Forbes

Grateful

We can always find many things to be thankful and grateful for, even if the world seems to be rapidly moving sideways.  

Happy Thanksgiving, folks.   

Posted in Uncategorized | Leave a comment

QOTD: Krispy Kreme’s Glazed Black Swan

QOTD:  Quote of the Day

Shares of Krispy Kreme Inc. were downgraded last month on concerns weight-loss drugs would reduce demand for their doughnuts.  – Bloomberg 

Posted in Uncategorized | Leave a comment

A November To Remember?

As of today’s close, the S&P move in just the first half of the month already ranks as the 6th most significant November monthly move in over seventy years.

It’s challenging to find a similar set-up going into the end of the year as the index was up 20 percent at the end of July and then took an 8.6 percent swan dive during the next three months, setting up this humungous bounce in the first few weeks of November.  Recall that, on average, November is the best month of the year for stocks by a wide margin, followed by December. 

Of course, the set-up for December will change if we get a decent pullback in the next few weeks. It’s stunning to hear some talking heads predict another 7-10 percent for the rest of the year.  It is possible, and we will take it,  but the empirical probabilities suggest otherwise, as illustrated in the above table. 

It’s a mug’s game trying to predict short-term stock moves, but we can’t help ourselves.  Given the seasonals, the empirical probabilities point higher, likely after the stock market digests this big move, churning and burning in a narrow range before the Santa Claus ramp. 

Today’s relative performance in the Russell 2000 was disappointing, but we do suspect that small caps will lead when the market begins its next holiday leg up.  If not, we will take it as a signal a recession looms.   

Who said this business was easy?  

Posted in Uncategorized | 1 Comment

Christmas & Toy Spending Headed South [Pole]?

Posted in Uncategorized | Leave a comment

Is It Russell’s Time?

This image has an empty alt attribute; its file name is russell_sp_2.jpg

Wow!  Humungo move on the decent inflation report.  A much higher probability of a soft landing is now being priced during the most wonderful time of the year for stocks.   

The Russell 2000 was up a stunning 5.4 percent on the day, though only the 27th most significant one-day move since 2000, and look at that multi-year underperformance.  We suspect any new discretionary money being put to work into year-end will have the name Russell.  Small sector swamped by a burst of buying pushes the Russell north, in our opinion.  And it is just that, folks: an opinion.         

Posted in Uncategorized | 1 Comment

Wiedersehen German Economy?

Posted in Uncategorized | Leave a comment

In Honor Of Veteran’s Day: The Butterfly Effect

Originally Posted: November 11, 2018

To honor Veterans’s Day,  we are reposting our June 2017 butterfly piece, which illustrates how sleepwalking can lead the world into a war that nobody wants.

French President, Emmanuel Macron, warned today about sleepwalking into another great conflict.

“I know there are old demons which are coming back to the surface. They are ready to wreak chaos and death. History sometimes threatens to take its sinister course once again.  – President Macron

Vets

History’s Biggest “Butterfly Effect” Occurred On This Day

The butterfly effect is the concept that small causes can have large effects. Initially, it was used with weather prediction but later the term became a metaphor used in and out of science.

In chaos theory, the butterfly effect is the sensitive dependence on initial conditions in which a small change in one state of a deterministic nonlinear system can result in large differences in a later state. The name, coined by Edward Lorenz for the effect which had been known long before, is derived from the metaphorical example of the details of a tornado (exact time of formation, exact path taken) being influenced by minor perturbations such as the flapping of the wings of a distant butterfly several weeks earlier. Lorenz discovered the effect when he observed that runs of his weather model with initial condition data that was rounded in a seemingly inconsequential manner would fail to reproduce the results of runs with the unrounded initial condition data. A very small change in initial conditions had created a significantly different outcome.  — Wikipedia

On this day in history, June 28, 1914, the driver for Archduke Franz Ferdinand,  nephew of Emperor Franz Josef and heir to the Austro-Hungarian Empire,  made a wrong turn onto Franzjosefstrasse in Sarajevo.

Just hours earlier, Franz Ferdinand narrowly escaped assassination as a bomb bounced off  his car as he and his wife,  Sophie,  traveled from the local train station to the city’s civic city.   Rather than making the wrong turn onto Franz Josef  Street, the car was supposed to travel on the river expressway allowing for a higher speed ensuring the Archduke’s safety.

Yet, somehow, the driver made a fatal mistake and tuned onto Franz Josef Street.

The 19-year-old anarchist and Serbian nationalist, Gavrilo Princip, who was part of a small group who had traveled to Sarajevo to kill the Archduke,  and a cohort of the earlier bomb thrower, was on his way home thinking the plot had failed.   He stopped for a sandwich on Franz Josef Street.

Seeing the driver of the Archduke’s car trying to back up onto the river expressway, Princi seized the opportunity and fired into the car, shooting Franz Ferdinand and Sophie at point-blank range,  killing both.

That small wrong turn,  a minor perturbation to the initial conditions, or deviation from the original plan,  set off the chain events that led to World War I.

Archduke_Jan27

Stumbling Into The Great War
Fearing Russian support of Serbia, Franz Josef would not retaliate by invading Serbia unless he was assured he had the backing of Germany.   It is uncertain as to whether the Kaiser gave Franz Josef Germany’s unequivocal support.   Russia, fearing Germany would intervene, mobilized its troops forcing Germany’s hand.

The great European powers thus stumbled into a war they didn’t want through complicated entanglements and alliances, and miscalculation.  Russia backing Serbia;  France aligned with Russia,  Germany backing the Austro-Hungarian Empire;  and Britian, who really didn’t have a dog in the fight except her economic interests, aligned with France and Russia.

Later the U.S. would enter the war due to Germany’s unrestricted submarine warfare threatening American merchant ships and the Kaiser floating the idea of an alliance with Mexico in the famous Zimmerman Telegram, which was intercepted by the British.

Of course, some will argue that Great War in Europe was inevitable

The great Prussian statesman Otto von Bismarck, the man most responsible for the unification of Germany in 1871, was quoted as saying at the end of his life that “One day the great European War will come out of some damned foolish thing in the Balkans.” It went as he predicted.  – History.com

Nevertheless,  maybe the course of history would have been different if not for that wrong turn on June 28, 1914, which created the humongous butterfly effect, which we still experience the consequences this very day.

The botched Treaty of Versailles  sowed the seeds the for World II.  The War contributed to the Russian revolution and Cold War.  The redrawing of borders in the Middle East after the War created the conditions for the instability and breakdown to tribalism the region experiences today.

A map marked with crude chinagraph-pencil in the second decade of the 20th Century shows the ambition – and folly – of the 100-year old British-French plan that helped create the modern-day Middle East.

Straight lines make uncomplicated borders. Most probably that was the reason why most of the lines that Mark Sykes, representing the British government, and Francois Georges-Picot, from the French government, agreed upon in 1916 were straight ones.  — BBC News

If Franz Ferdinand had not been murdered on this day in history,  that conflict between the Serbs and the Austro-Hungarian Empire may have been contained to just the Balkans.   Maybe.

The butterfly effect.  Think how many small events, decisions, mistakes, one small turn, or “minor perturbations” in plans have had enormous consequences in your own personal life.

Posted in Geopolitical, Uncategorized | Tagged , , | Leave a comment