
On the eve of nonfarm payrolls here is a nice data dump that gives a good roadmap of what and how many jobs have been created since 2010. We’ll layout just the data with some bullet points and let you make your own conclusions.
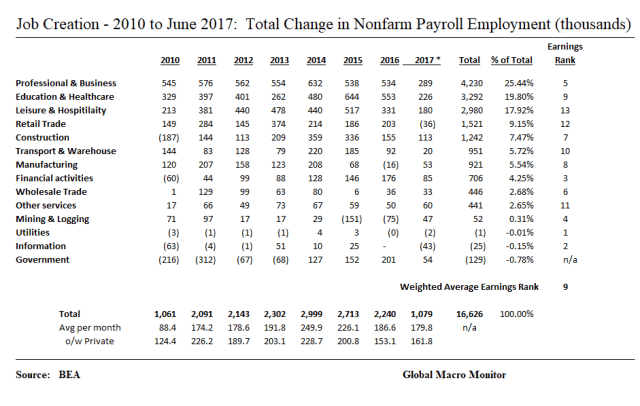
- Over 16 million nonfarm jobs have been created since the beginning of 2010, averaging 184K per month.
- Total nonfarm payrolls will have to average 193K per month for the rest of 2017 to equal the 2.24 million jobs created in 2016.
- 25 percent of the jobs created since in 2010 were in the Professional & Business sector, which ranks 5 on a scale of 13 in terms of average hourly earnings.
- Almost half of the jobs – 47 percent – created over the past 7 1/2 years were at the lower end of the pay scale – Education & Healthcare (9); Leisure & Hospitality (13); and Retail Trade (12).
- The Government, Information, and Utilities sectors lost jobs over the period.
- The weighted average wage rank of all jobs created since 2010 is a 9 out 13 in terms of average hourly earnings.
- Education & Healthcare top nonfarm payrolls at almost 16 percent of total employment.
- The Ultilities and Information sector ranked the highest in average hourly earnings in June 2017 with Retail Trade and Leisure and Hospitality at the bottom. See here for more detailed breakdown of wages by sector.
- Information and Financial Activities experienced the strongest real wage growth over the period with the Transport and Warehouse and Manufacturing sector the weakest, with zero real wage growth.
.
.

.

.


