
Ten Key Takeaways:
- Record Enrollment: Medicaid peaked at 26% of the U.S. population (88.2 million people) in FY 2024, cementing its status as the nation’s largest insurer.
- Decoupling Welfare: Structural growth began when late 1980s mandates disconnected healthcare eligibility from cash public assistance programs.
- Income Standard: The ACA replaced demographic restrictions with a standardized, income-based limit up to 138% FPL.
- Welcome-Mat Effect: Simplified enrollment processes prompted millions of previously eligible but unenrolled individuals to sign up.
- Continuous Enrollment: The 2020 FFCRA barred states from disenrolling anyone during the pandemic, stabilizing national coverage.
- Procedural Unwinding: The post-pandemic “unwinding” stripped coverage from 20.7 million people, though 68.7% of these were due to procedural paperwork errors.
- The OBBBA Shock: The newly enacted One Big Beautiful Bill Act of 2025 represents the largest-ever cut to basic needs programs, slashing over $1 trillion in federal healthcare spending and leading to over 10 million more uninsured Americans.
- Mandatory Work Requirements: Starting in 2027, able-bodied adults in the expansion population must meet an 80-hour monthly work or community service mandate, which is expected to disenroll over 5 million people.
- Administrative Barriers: The OBBBA doubles the frequency of eligibility redeterminations to every six months for the expansion population, threatening to disenroll an additional 700,000 people due to paperwork.
- State Funding Restrictions: Capping provider taxes from 6% to 3.5% under the new law severely restricts state fiscal capacity, creating deep budgetary pressures.
Our analysis in our recent post, “America’s Fiscal Mirage: Tariff Sugar Rush, Structural Hangover,” highlights that while recent deficit figures may appear to show a very slight improvement, they mask a deeper, persistent fiscal fragility driven by structural imbalances rather than sustainable reform. Despite temporary boosts from tariff revenue, many of which are now under threat from recent legal reversals, the long-term outlook remains grim, as mandatory spending continues to operate largely on autopilot. Central to this challenge is the sheer scale of entitlement costs; for instance, Medicaid spending alone now accounts for approximately 15 percent of total U.S. government outlays, creating a rigid spending floor that complicates any meaningful attempt to curb the nation’s mounting debt trajectory.
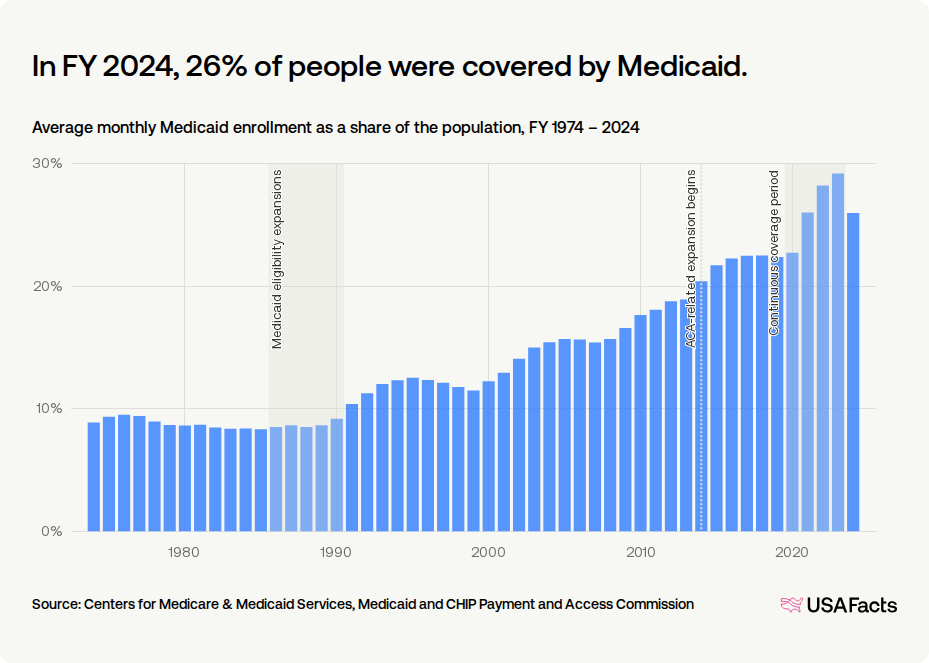
The structural landscape of American healthcare has undergone a seismic shift. As highlighted in the historical data, a monthly average of 26% of the U.S. population was covered by Medicaid in fiscal year (FY) 2024. For a program created in 1965 to act as a highly restrictive safety net tied strictly to cash welfare , this represents a fundamental social and fiscal transformation.
As an economist analyzing this trajectory, it is clear that this dramatic enrollment surge was driven by compounding policy waves visible in the historical trends:
1. Welfare Decoupling (The 1980s & 90s Spikes)
Originally, Medicaid required enrollees to receive cash welfare assistance. Congressional mandates during the “Medicaid eligibility expansions” of the late 1980s and early 1990s decoupled these requirements, expanding eligibility to low-income pregnant women and children regardless of welfare status. This separation was finalized by the 1996 welfare reform and the 1997 launch of the Children’s Health Insurance Program (CHIP).
2. The ACA’s Standardized Eligibility (2014)
The Affordable Care Act of 2010 fundamentally modernized Medicaid by establishing a standardized, income-based model. In the states that adopted expansion, coverage opened to all nonelderly adults earning up to 138% of the Federal Poverty Level (FPL). This was incentivized by a permanent 90% federal matching rate (FMAP) and triggered a massive “welcome-mat” or “woodwork” effect, enrolling millions of previously eligible but unenrolled individuals.
3. Pandemic Continuous Coverage (2020–2023 Peak)
The most dramatic enrollment acceleration occurred during the COVID-19 pandemic. Under the Families First Coronavirus Response Act (FFCRA) of 2020, states received enhanced FMAP funding in exchange for keeping enrollees continuously covered. By halting annual administrative eligibility checks, this policy eliminated enrollment “churn,” sending rolls to a peak of 94 million by early 2023.
4. The Great Unwinding (Post-Pandemic Correction)
Following the end of the pandemic continuous coverage mandate, states began the massive “unwinding” process, conducting redeterminations that resulted in over 20 million disenrollments—moderating FY 2024 coverage back to 26%. Many individuals were disenrolled for “procedural” reasons—such as failing to return renewal paperwork—rather than for a true loss of financial eligibility.
5. The “Big, Beautiful Bill” and the Retrenchment Era
The historical upward trajectory of Medicaid coverage shown in the chart—where enrollment expanded from a modest 8% in the 1970s to a peak of 26% of the population in FY 2024 —is poised for an unprecedented reversal. On July 4, 2025, the budget reconciliation package colloquially known as the “One Big, Beautiful Bill Act” (OBBBA) was signed into law, enacting the largest-ever cuts to basic needs programs in U.S. history. To fund tax cuts, the legislation is projected to slash federal healthcare spending by over $1 trillion, including $911 billion in direct Medicaid cuts, resulting in an estimated 10 million fewer insured Americans over the next decade.
The single largest driver of this projected contraction is the nationwide implementation of mandatory work and community engagement requirements starting January 1, 2027. Under the OBBBA, non-disabled adults in the ACA expansion group (ages 19-64) must document at least 80 hours of work, community service, or education per month to maintain their coverage. The Congressional Budget Office (CBO) estimates this provision alone will reduce federal outlays by $326 billion over ten years, causing upwards of 5 million people to lose coverage. Furthermore, the law doubles the frequency of administrative checks, forcing these expansion enrollees to undergo eligibility redeterminations every six months rather than annually. This increased paperwork burden is expected to strip coverage from an additional 700,000 eligible individuals. Coupled with a reduction in the Medicaid provider tax cap from 6% to 3.5%—which severely restricts state funding capacity—this law signals a dramatic, policy-driven retrenchment that will sharply bend the historical enrollment curve downward.
Sources:
- USAFacts: Monthly Average Medicaid Enrollment & Population Share.
- Kaiser Family Foundation (KFF): Health Policy 101, Unwinding Tracking, and Reform Overviews.
- Medicaid and CHIP Payment and Access Commission (MACPAC): MACStats & Unwinding Data Brief.
- National Bureau of Economic Research (NBER): Research Papers on ACA Medicaid Expansions & Fiscal Federalism.
- American Medical Association (AMA): Briefings on the One Big Beautiful Bill Act.
- GoodRx & RAND Corporation: Impact analysis of the One Big Beautiful Bill Act.



“For a program created in 1965 to act as a highly restrictive safety net tied strictly to cash welfare , this represents a fundamental social and fiscal transformation.” Can you expand on this, thanks.
When Medicaid was created in 1965 alongside Medicare, policymakers designed it as a residual welfare program — meaning assistance would go only to the “deserving poor” who were already receiving cash welfare benefits. In practice, that mostly meant:
The original philosophy was restrictive:
In economic terms, Medicaid was not envisioned as a universal entitlement like Social Security. It was intended as a narrow backstop for extreme poverty.
But over the next sixty years, America changed:
As those pressures mounted, Medicaid quietly transformed.
Today, Medicaid is no longer merely “welfare.” It is:
After the Affordable Care Act, the transformation accelerated further. Medicaid expansion detached eligibility from traditional welfare status and tied it instead to income thresholds. Millions of working adults with jobs — but without affordable insurance — entered the system.
That marked a philosophical shift:
America moved from:
“Medicaid is for people on welfare”
to:
“Medicaid is part of the national healthcare infrastructure.”
That is the “fundamental social transformation” the sentence refers to.
The fiscal transformation is equally profound.
In 1966, Medicaid spending was tiny relative to the economy. Today, combined federal and state Medicaid spending exceeds $800 billion annually and represents one of the largest categories of government expenditure in the United States. Entire sectors of the healthcare system now depend on it financially:
This creates enormous political consequences.
Programs initially designed as temporary or narrowly targeted often become politically durable once:
That is exactly what happened with Medicaid.
So the sentence is really describing a historic evolution:
a program originally conceived as a limited anti-poverty safety valve has gradually become a quasi-universal health and long-term-care support system embedded deeply into American economic life.
In many ways, Medicaid’s history mirrors a broader truth about modern democracies:
once healthcare costs become too large for households to bear alone, governments tend to absorb a growing share of the risk — even if that was never the original intent.