
Not that long ago, by the way.
My good friend, David Jones, sent over some new data this past weekend. We have been busy.
Our First Take
Not a lot of prose tonight as we will let the data and charts speak with only some short comments. We take a quick look at two issues in this post: 1) the growing wealth inequality in the U.S., and 2) the massive hit the American middle class took during the Great Financial Crisis (GFC).
Stay tuned for more analysis in future posts.
Stunning Growth In Wealth Inequality
Though we were cognizant of the growing inequality of wealth in the United States, we had not really internalized it and were shocked — no, floored — by the following data.

The table of data speaks volumes and explains much of the dynamic currently taking place in the U.S. economy and the American body politic.
The net worth of the top 1 percent compared to the bottom 50 percent has increased from a multiple of 6.5 in Q1 1990 to 26.0 in Q4 2018. Absolutely stunning!
In growth terms, the wealth (net worth) of the top 1 percent has increased by 532 percent in the same period compared to only a 57.1 percent increase in the net worth of the bottom 50 percent. Whereas the growth rate of the 1 percenters has outpaced nominal GDP by 2x since 1990, the net worth of the bottom 50 percent has tracked the economy by a paltry factor of 0.2, which truly reflects how the American economy has morphed into the asset-driven beast that it now is.
The moral of the story here is you better own assets. Pity, or maybe fear, the younger generations saddled with their student loan debt and the debt they will inherit from the baby boomers.
Middle-Class Devastated During The GFC
The most shocking chart of our first cut at the data was the quarterly time series of the bottom 50 percent’s net worth.
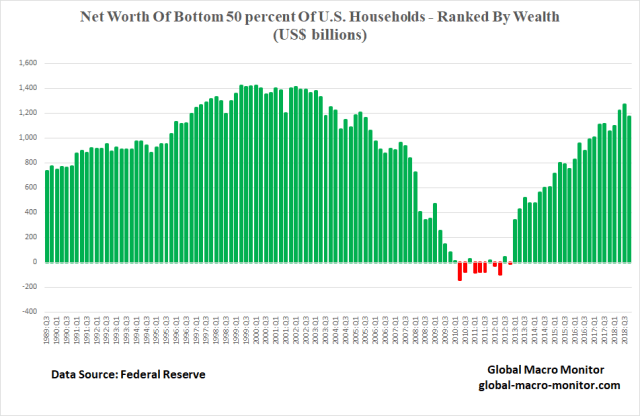
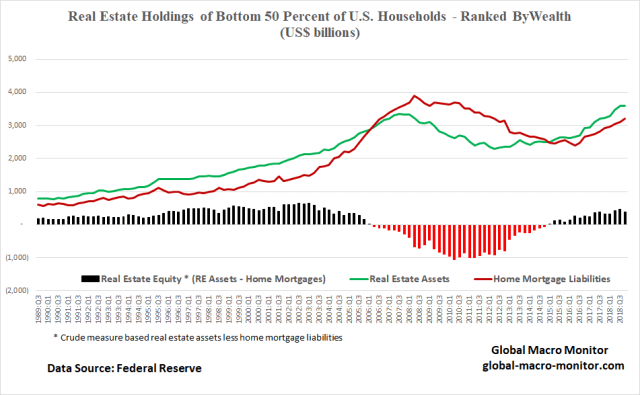
The bottom 50 (the data are aggregated thus not all households were insolvent) lost its entire net worth during the GFC and was technically insolvent (liabilities exceeding assets) during 8 of the 11 quarters during the period of Q2 2010 to Q4 2012. The collapse in housing prices was the main culprit as the chart below illustrates but dig a little deeper and the huge increase in home mortgage leverage, which the cohort began to take on in earnest during the early 2000s, was, a, or, the, major factor in the destruction of wealth.
Nothing new here but interesting to finally see laid out in a clear and concise manner.
Though the Fed’s quantitative easing (QE), which targeted asset prices — as inflating them — shares much of the responsibility for the growing wealth inequality, it also helped resurrect the balance sheet of the bottom 50 percent. Some call QE “socialism for the rich” but there is no doubt some did trickle down to help the lower 50 recover some their net worth.
We suspect or know almost certainly, many households are being lost in translation – in the aggregation and averaging. Several million have yet to recover in our bifurcated economy.
We still need to take a deeper dive into the data but we did notice a big chunk in the recovery of the net worth of the lower 50 was the reduction in home mortgage liabilities. We not yet sure how this took place but suspect much was through default, foreclosure, and debt forgiveness. We also noticed big jumps in certain quarters.
How Did The 1 Percent Fare During GFC?
Not too bad, in a relative sense, especially when juxtaposed to the hit the lower 50 took during the GFC. This is reflected in the chart of the 1 percenters net worth.
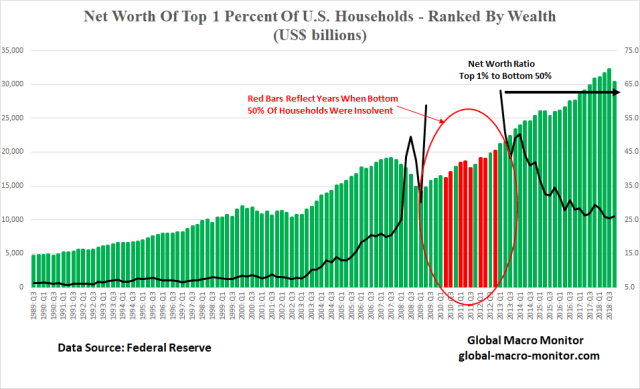
The net worth of the 1 percent fell almost 26 percent from Q3 2007 to Q1 2009, the respective peak and trough of the stock bear market.
Note the red bars also reflect the quarters when the lower 50 were technically insolvent. In some of those quarters, the wealth of the 1 percent actually increased. That rage was felt and reflected in the 2016 presidential election and is still playing out in real political time.
Upshot
We have nothing against the 1 percenters, after all, we were part of, and may still be a member of that cohort. The data does show the unsustainability of the current situation, however, both economically and politically.
We implore the plutocracy to take the data seriously, make a plan and commit to making and paying for the necessary social investments to stave off a more severe political disruption. The optimal solution is always to help pull others up rather than having them pull you down.
Trump Not The Answer
We firmly believe Donald Trump is not the answer and is just a warm-up act to the real deal that may be yet to come. We have looked at the economic data under the Trump administration, which we will present in the next few days, and the needle has moved very little and is reflected in the current polling data.

A truer form of populism is moored in the economics of the left, in our opinion, though President Trump gets a lot of mileage from his anti-trade rhetoric and policies even as farmers seem to be turning on him.
China Trade Deal At The G20?
It’s going to be interesting to watch how he walks the fine line of trying to keep stocks afloat by cutting a trade deal with China’s President Xi at the G20 next week, while simultaneously feeding the base the red China meat. Irreconcilable differences, in our opinion, unless Xi or Trump caves. Not likely.
Trojan Horse For The Rich
Nonetheless, a narrative is taking shape that the Trump administration is more of a Trojan Horse for the 1 percent — tax cuts for the wealthy, cuts to social services, and pumping stocks, where the top 10 percent directly hold 86 percent of total stock wealth with the bottom 50 holding less 1 percent; presented as a Honey Boo Boo reality show to entertain the base. Not exactly the savior of the working class.
We may or may not agree with the narrative, which is really not the point, but it’s inflating out in the ether and appears to be impacting the polling data, so please, spare us the hate mail.
Stay tuned for Mr. Toad’s Wild Ride, folks. Long pitchforks and water cannons.


Pingback: The Innate Angst Of Inequality | Global Macro Monitor