
In keeping the commitment we made to our readers in the post, America’s Perilous Path Of Wealth Distribution, we follow up with some additional and interesting data on wealth distribution in the United States. If you haven’t read Sunday’s post, run don’t walk to gather some background for the following data. See here.
Here’s the summary section,
Summary
- We illustrate the stark contrast in the growth of household wealth between the different percentile groups since Q1 2000
- The top 1% of households now hold more wealth than the bottom 90%
- The aggregate nominal wealth of the bottom 50% of households has fallen by almost 10 percent since 2000, from 3.4 percent of total household wealth to just 1.3 percent
- The share of the top 1% is now over 31 percent and has grown by over 165 percent since Q1 2000
- The average wealth per household of the bottom 50% has declined 25 percent in nominal terms and 50 percent in real purchasing power compared to the 1%’s increase of 118 percent and 50 percent, respectively
- The widening wealth gap is a major factor in the rise of populism in the U.S. and the debate over a wealth tax will be a central focus of the 2020 presidential election
- Asset inflation resulting from quantitative easing (QE) has contributed to the widening wealth gap
The following tables illustrate and present the aggregate wealth data from the Fed’s new Distributional Financial Accounts (DFA). Note we use the terms “wealth” and “net worth” interchangeably.
Wealth Distribution By Percentile

This table was in our original post.
Key Takeaways
- Top 1% now hold more wealth than the bottom 90%
- Top 10% hold over 70% of U.S. household wealth
- Bottom 50% experienced a decline in aggregate wealth
- Bottom 50% hold a mere 1.3 percent of household wealth
Wealth Distribution By Growth Rates By Percentile Group

Key Takeaways
- Bottom 50% of households experienced an 8.6 percent decline
- 90-99% percentile group experienced the most rapid growth
- Household wealth expanded faster than nominal GDP by a factor of 1.3x
- Asset markets experienced two ugly bear markets during the period yet growth aggregate wealth and nominal GDP still diverged, which is not sustainable
Wealth Distribution As A Percent Of GDP Growth By Percentile Group
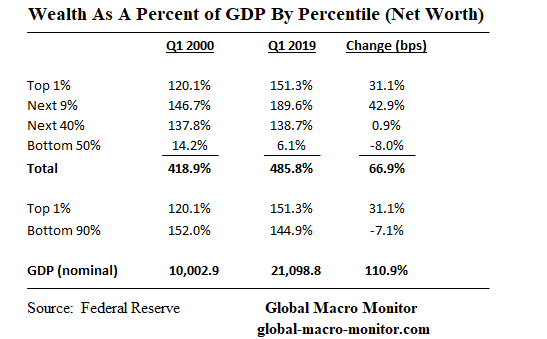
Key Takeaways
- Household wealth expanded to 486 percent of GDP by Q1 2019, which is historical, if not, the historical high.
- Bottom 50% of households saw their wealth fall from 14 percent of GDP to 6.1 percent
- 50-90% of percentile group household kept just kept pace with GDP growth
Distribution Of Wealth Gains By Percentile Group
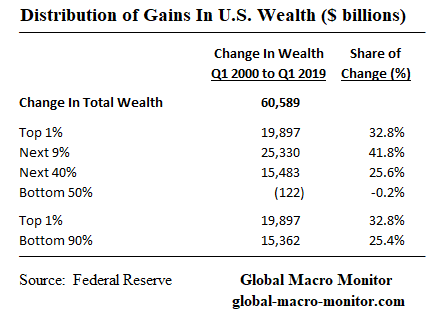
Key Takeaways
- Total U.S. household wealth increased by $60.6 trillion from Q1 2000 to Q1 2019
- Bottom 50% transferred a small portion of their wealth to the up 50%
- 10% of households took down almost 75 percent of wealth gains
- 90-99% percentile group, with wealth per household ranging from $1.5 million to $11 million, took the largest portion of gains, or 41.8 percent of the $60.6 trillion increase in total wealth.
Note the data are not drawn from a panel study, which is a particular design of data where each unit of analysis is followed at specified intervals over a long period. That is many of the households in each percentile moved into other percentiles over the period.
Upshot
Long pitchforks.
Stay tuned for a couple more posts on Wealth Distribution in America.
Running Out Of Free Lunches
We are almost out of free lunches, folks, and will be posting only sporadically unless your support increases. Donate whatever you think is fair by clicking on the PayPal button just below the Twitter and search icons on the upper right-hand side of the blog. You do not need a PayPal account and can use almost any credit card.
Don’t be a free rider. Thanks, so much.


The Fed has artificially inflated the value of financial and real assets, enriching those fortunate enough to own them, and leaving the rest of the population in the dust.
Exactly, John.
Pingback: How The Rich Get Richer And The Poor Get Poorer | Global Macro Monitor
Pingback: How The Rich Get Richer And The Poor Get Poorer – SYFX+
Pingback: How The Rich Get Richer And The Poor Get Poorer | ValuBit
Pingback: How The Rich Get Richer And The Poor Get Poorer | Zero Hedge