
A shout out to our beloved Carol K., who is very sick but still fighting the good fight in a Boston hospital. She has been couped up in medical isolation from family and friends for almost seven months. CK is recovering from a stem cell transplant to treat her acute myeloid leukemia, which was most likely the result of two rounds of chemotherapy for ovarian cancer and her bout with COVID earlier this year.
It’s been a cruel past month as CK was due to be released twice but experienced setbacks. First, she slipped into a coma from complications of a newly diagnosed meningitis. Then after waking, she contracted influenza and pneumonia, all while fighting acute kidney failure, and, today, lays very sick in her hospital bed in Boston.
In spite of her many illnesses and isolation, she still comports herself with class, dignity, kindness and postivity. Take a look here of what she Tweeted just last Friday. If anyone has a reason or right to be angry and to fire off nasty Tweets, it’s our Carol K.. But that is not who she is. Though country strong and tough, CK has major league class.
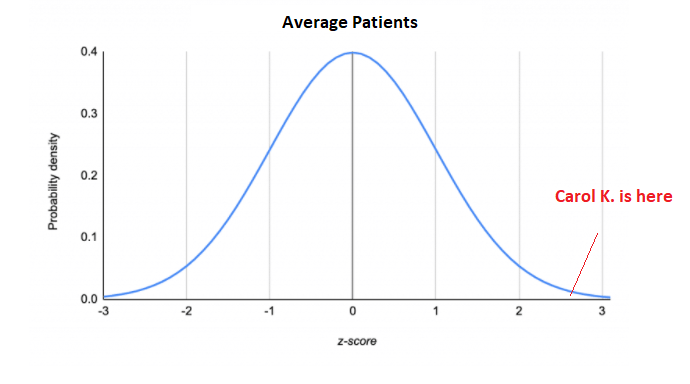
She is one tough lady, has beat all odds even confounding her own medical team, and why she is known as the “right-tail girl” at the Global Macro Monitor.
Billy Joel should write a song about her.
Keep bringing all you got, prayers, positive thoughts, candles, crystals, manifestations, anything, and everything her way, folks. Please.
The Economic Future
First, a big caveat.
Nobody knows the future with certainty, especially regarding markets and the economy.
Isaac Newton, one of the most renowned thinkers and scientists in history, believed he could predict markets with the same precision as he did the motion of the planets.
He lost a boatload in the “South Sea bubble” of 1720. Markets humble even the best and the brightest.
The experience led Newton to conclude,
“I can calculate the motions of the heavenly bodies, but not the madness of the people.”
Markets and the economy are driven by the sum of the preferences of all of its participants, who are sometimes rational and more often than expected, “mad.”
We believe Newton’s South Sea bubble debacle is how he indeed discovered the modern science of gravity. Well, kind of.
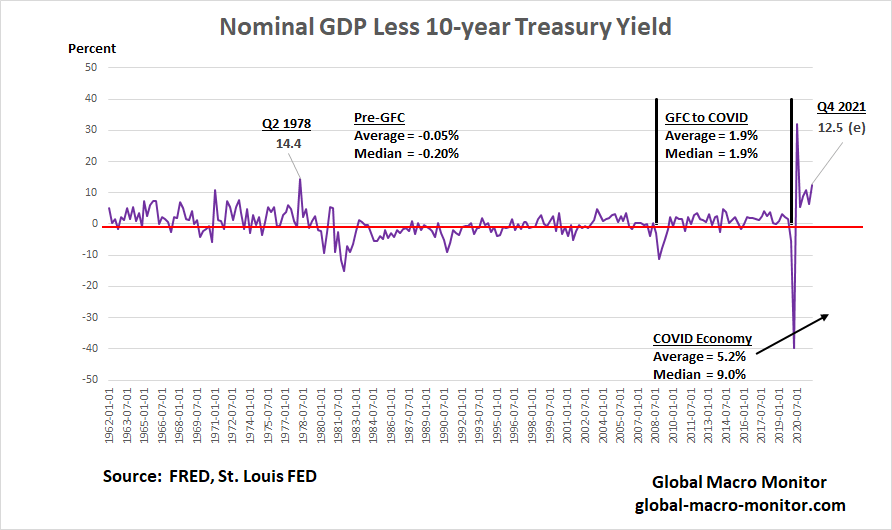
Nominal GDP And 10-Year Treasury Yield Gap
Yield Gap = Quarterly Annualized Nominal GDP Growth – Quarterly Average 10-year T-Yield
Though we strongly believe capital flows primarily determine asset prices as markets are much less efficient, if at all, than academics assume, the following chart helps explain, at least to us, the resilience in the stock market this quarter.
Short sellers have been scorched over the past few weeks, believing stocks were peaking at historically extreme and wild valuations. At the same time, the Fed downshifts monetary policy, albeit from super easy to less super easy. Nice try. I have felt that pain, not fun.
As the above chart illustrates, if today were year-end, the Q4 yield gap between quarterly nominal GDP growth and the 10-year Treasury yield would come in around 12.5 percent. Such a significant spread has happened only on two other occasions: the Q3 2020 COVID aberration, when nominal GDP bounced 33 percent after its almost 40 percent decline the prior quarter, and Q2 1978.
Our Q4 estimate assumes the Atlanta Fed’s Q4 real GDP now forecast is actualized at its current estimate of 8.7 percent. The model has a respectable track record.
The chart also illustrates what an abnormal and extraordinary strange environment the economy and markets are currently operating in.
Corporate Profit Bonanza
It’s not that hard then to conclude that a Q4 2021 nominal GDP print of around 14 percent with the 1.5 percent 10-year yield, reflecting super-easy monetary policy and a distorted yield curve, will be a bonanza for corporate earnings. Thus, the stock market’s surprising strength and dearth of real money sellers.
Any unexpected acceleration of the tightening cycle – note, tightening is still a long way off — will be a problem for the market, at least we think it should be. It could come after the CPI print tomorrow, or not.
We do hear rumors that Jerome Powell does not want to “lose the stock market.” He may soon be forced to make a choice between runaway inflation and the stock market, however.
Bond Market Conundrum 2.0
Many market observers are dumbfounded as to why long Treasury yields are so low with current inflation running above 6 percent year-on-year. It’s “Bond Market Conundrum 2.0.”
Bond Market Conundrum 1.0
In his February 2005 Congressional testimony, then Fed Chairman, Alan Greenspan wondered out loud why long-term rates were falling while the Fed was raising the Fed Funds rate.
In this environment, long-term interest rates have trended lower in recent months even as the Federal Reserve has raised the level of the target federal funds rate by 150 basis points. This development contrasts with most experience, which suggests that, other things being equal, increasing short-term interest rates are normally accompanied by a rise in longer-term yields… For the moment, the broadly unanticipated behavior of world bond markets remains a conundrum. Bond price movements may be a short-term aberration, but it will be some time before we are able to better judge the forces underlying recent experience. – Alan Greenspan, Feb. ‘2005
Pre-GFC Tightening Cycle
Sensing overheating in the housing and credit markets, the Fed began raising interest rates in June 2004, albeit very slowly. The tightening cycle didn’t end until September 2007 after the Fed Funds rate had risen 425 basis points from 1.0% to 5.25 percent, which finally punctured the housing and credit bubble.
During that tightening cycle the 10-year Treasury yield peaked twice in June 2006 and June 2007 at around 5.25 percent, which was not prohibitive to the mortgage market and allowed the housing and credit bubble to run for another three years after the Fed’s first move. No three steps and stumble, more like 17 steps and stumble over a giant cliff.
Bear Sterns failed in Q1 2008 and the rest is history.
Foreign Central Banks Recyling Reserves Into Treasury Market
At the same time the Fed was tightening, foreign central banks were recycling their balance of payments (BOP) surplus’ into the Treasury market, taking down over 48 percent of the new issuance of Treasury notes and bonds from June 2004 to September 2007, either directly or indirectly.
In a 2012 paper published by the Federal Reserve Board (FRB), economists estimated the impact of foreign central bank flows into the bond market,
Putting these results into context, between 1995 and 2010 China acquired roughly $1.1 trillion in U.S. Treasury notes and bonds. A literal interpretation of our long-run estimates suggests that if China had not accumulated any foreign exchange reserves during this period, and therefore not acquired these $1.1 trillion in Treasuries, all else equal, the 5-year Treasury yield would have been roughly 2 percentage points higher by 2010. This effect is large enough to have implications for the effectiveness of monetary policy. – FRB
Have you got that, folks? The Fed paper concludes that China’s inflows alone, all other things being equal, kept the 5-year note yield 200 basis points lower than where it would be in 2010.
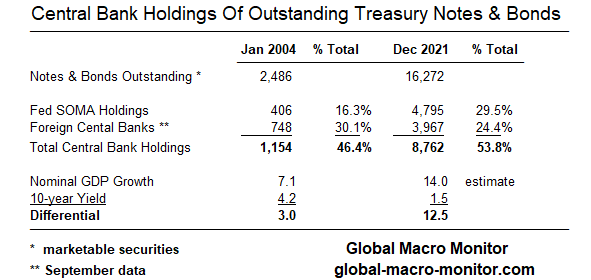
Foreign central banks currently own about $4 trillion, or about 25 percent of all marketable Treasury notes and bonds outstanding, which is signifcanly lower than prior to the GFC. The Fed holds $4.8 trillion or about 30 percent of all outstanding Treaury coupon notes and bonds.
Greenspan Lost Control Of The Yield Curve
Greenspan ultimately blamed the Fed’s loss of control of the yield curve, much of it due to foreign central bank inflows as the primary monetary factor inflating the housing and credit bubble,
Despite the fact that we lowered rates, we did not have long-term rates moving down. We did not have money supply accelerating. There were no fingerprints of an easy money policy in the marketplace. – Alan Greenspan, April 2014
Whatever, dude. You were too slow.
Repression
Why is the 10-year Treasury yield so low with inflation running so hot? We maintain for same reason there are no mass student demonstrations in Tinanmnen Square: Repression.
Though we hear the Fed has accounted for aound 50 percent of the COVID Treasury new issuance, their indirect purchases of the $3.6 trillion of net new issuance of notes and bonds are over 75 percent. That is, Fed has bought up three quarters of the entire new issuance of COVID notes and bonds.
We wonder out loud where yields would be without the Fed? We can speculate using the Fed’s 2012 model cited above. We conclude much higher and discount whatever long bond yields are signalling.
The Dearth Of Long Cash Coupon Treasury Securities
Moreover, on a relative basis, there are just not many long-dated Treaury securities outstanding available to the non-central bank public, who are market sensitive and actually care about prices and entry points.
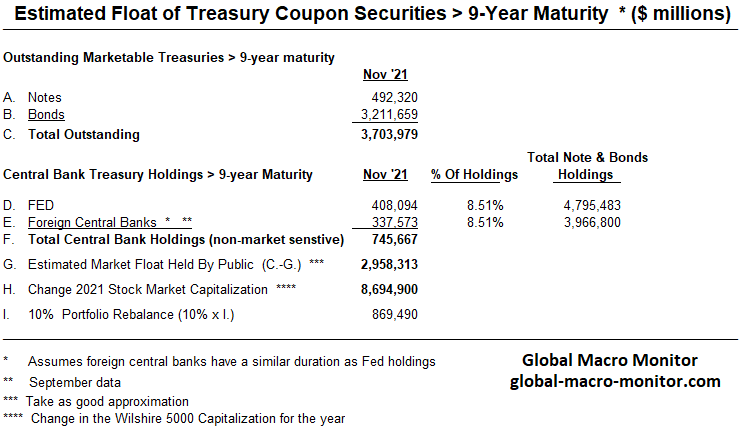
We have calculated, based on data from the Monthly Statement Of The Public Debt, and illustrated in the following chart and table, the outstanding stock of marketable Treasury securities with maturities longer than nine years is only $3.7 trillion. Absolutely large, relatively small.
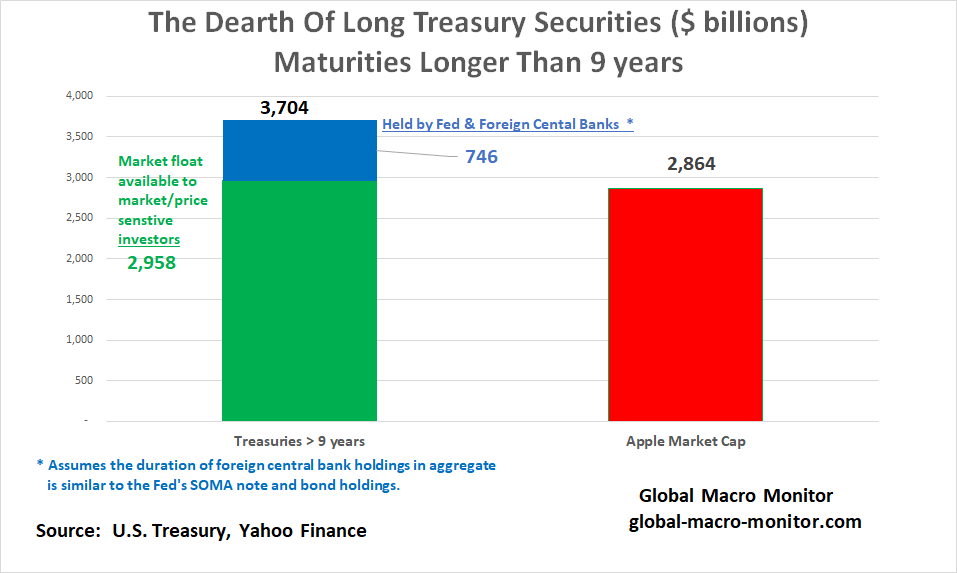
The chart highlights how relatively small the stock of Treasury coupon notes and bonds with maturies longer than nine years is when compared to, say, Apple’s market capitalization. Excluding central holdings, the float available to market & price sensitive investors is about the same size as Apple’s market cap.
Rebalancing Effect
We have also estimated the demand for longer dated Treasury securities based on the rebalancing effect from this year’s gains (December 7th close). Assuming 10 percent of all of this year’s stock market gains are reallocated to longer Treasury securties — may be a stretch, but hypoble does help make a point – it would take out about one third of stock of notes and bonds with maturities longer than nine available to the price sensitive public.
The upshot is there is a structural short of risk-free duration and just not many, on a relative basis, long maturity Treasury coupon securities floating around as the Fed and foreign banks hold about 20 percent of the outstanding stock.
Reverse Operation Twist?
The Fed may also be forced into a reverse “Operation Twist,” where they sell longer dated maturies and buy shorter dated, if they start to lose the yield curve as they did in 2004-2007. A yield curve inversion, primarily caused by technical factors could be castrostrophic if markets misinterpret the factors driving it and act on it.
We will take Issac Newton’s lead as to where we think the markets are headed. We can calculate the various stocks of outstanding debt and macro valuations but not the madness of people.
Nevertheless, as Carol K. has taught me over the past 18-months,
Let it ride until it slides.
She is an investor with trader instincts.
Stay tuned, folks.


This is only marginally related to bond yields, but I was wondering what your thoughts were regarding the relationship between the current surge in inflation and the behavior of the dollar. Looking at the FRED’s nominal dollar index, we can see a big decline in the dollar’s value during occurred during the pandemic. However, it has since been oscillating in an upward direction. Does this tell us anything about the nature of the inflation we’re experiencing? Usually inflation accompanies a decline in the dollar’s value, correct? (I know some commentators actually *define* inflation that way). Does this suggest those predicting the current inflation will be ‘transitory’ are more right than wrong? Does it suggest the opposite? Would like to hear what GMM thinks.
My priors are dollar strength anticipating interest rate hikes. If markets believe the Fed is losing spine, dollar should tank. Stocks not on same page, yet.