What makes elite athletes thrive or dive under pressure? | The Economist

Psychology is an increasingly important part of elite sport. Winning at the highest levels can depend as much on peak-fitness of the mind as the body.

Click here to subscribe to The Economist on YouTube: https://econ.st/2xvTKdy

Posted in Sports, Uncategorized | Tagged , | Leave a comment

Stopped Out of S&P; Jumping Back Into Brazil

Mother Fudger!

The tape bomb about the U.S. keystone cops capitulating on the tariffs in China trade negotiations kicks in the aglos taking the e-minis right up to my stop only to reverse.  Those ‘bots are tough MoFos to beat and have been killing us for the past three years.  Sometimes, you feel the market has it personally in for you.

Not true.  Mr. Market could give a shit about your positions.

These guys running economic policy in this administration may be the worst in history.  And I’m not saying that out of spite because I lost money today.

There is no doubt in my mind the final China Trade Deal will be another Potemkin Village with only some cosmetic adjustments just as NAFTA 2.0 and the Korean Deal were.

Mnuchin and Malpass are up against these guys,  who know Trump wants a deal?

China’s crack team of trade negotiators is professional, productive and ruthless and has been described by a group of their international counterparts as “among the best in the world”. – SCMP,  January 8th

Regrouping

We have bid mauled by Bidzilla in the S&P over the past week.  Shorts are not working.  They will someday, in our opinion.

We have to a better job on managing our stops and sticking with our winners.

We sold China too early and left $6K on the table being a dick-for-a-tic trying to get back into Cable with 1.26 handle.  The Sterling March contract is now trading with a 1.30 handle as we write.  We are hoping to get back into favorite global macro trade at lower levels.  Don’t want to chase it here but tough to be patient.  You know FOMO is a real bitch.

It looks like the S&P is going to close above the 50-day, so we are jumping back into 8K shares of the  Brazil ETF, EWZat $43.00, right where we took profits on January 10th.  Stop at $41.77.

Our gold position is going nowhere and getting stale but we are sticking with it and will add with a breakout over $1300.

Overtrading is hazardous to your P&L.  Who said trading was easy?

Long-term investors should take into account our view but take the trading as sheer entertainment and enjoy the schadenfreude.

trades


Posted in Trades, Uncategorized | 2 Comments

Getting Long Call Options On Phillies

I wish.

The Phillies are not a publicly listed company as is Manchester United, for example, or as the Boston Celtics used to be before going private. Maybe Cramer knows how to play this one.

Check out the latest rumor on the Bleacher Report.

The Philadelphia Phillies are reportedly trying to maintain financial flexibility with an eye toward a serious push to sign Los Angeles Angels superstar outfielder Mike Trout, who can become a free agent following the 2020 MLB season.

On Wednesday, Tom Verducci of Sports Illustrated reported the Phillies have enough money to acquire both infielder Manny Machado and outfielder Bryce Harper—this year’s most coveted players in free agency—but would rather add one and keep a path open to attracting Trout.  – BR, January 17

The modern-day Ruth and Gehrig in Philly?

I have no doubt if Trout can stay healthy, we all be sayin’ twenty years from now,

The goes Roy Hobbs Mike Trout the best there ever was in this game.

trout

By the way,  I took a Sabermetrics course a few years back from Boston Univerity and my priors were that Colorado’s  Coors Field and Cincy’s “Great American Small Park” were the stadiums where the most home runs were launched.   Wrong.  It is Philly’s Citizen Bank Park.

No wonder Bryce is considering the Phillies.  He may hit 80 home runs in 2019!

My Giants’ AT&T Oracle Park ranks among the worst for home runs.  Uncle Larry reportedly just paid $300-350 million for the naming rights to the park.  Now the Giants can afford to pay the Mad Bum his $200 million contract.

AT&T Oracle is a great park for triples, by the way.


Check out the chart of Man U’s stock price.  Flashing a red card and looks like it could use a little help, maybe from  Maradona’s “the hand of God.”

manu


Posted in Sports, Uncategorized | Tagged , , , , , | Leave a comment

Limit Order On S&P Executed

Per last night’s post, our sell of 5 contracts of the  S&P e-minis just got done at 2618.  Feels uncomfortable and still gun shy after our last S&P facial but sticking with the discipline of our plan and signal.  Stop at 2645.

We post these trades so that our readers can hold us accountable and measure the efficacy of our views.  For some readers it is unnecessary noise.  Let us know.

Posted in Uncategorized | 3 Comments

This Day In Financial History – Jan 17

From the great Jason Zweig

January 17:

1991: As the U.S. military blasts Baghdad and Kuwait, driving back Saddam Husseins invading troops, the Dow Jones Industrial Average shoots up 4.6% to close at 2623.51.

http://www.history.navy.mil/wars/datesjan.htm;
http://www.pbs.org/wgbh/pages/frontline/gulf/cron;
http://www.desert-storm.com/War/chronology.html;
http://averages.dowjones.com


1946: Slow down, bull! With the stock market up more than 20% since World War II ended just five months earlier, the Federal Reserve Board temporarily eliminates all margin trading, preventing anyone from trading stocks with money borrowed from a broker.

Today in NYSE History, at www.nyse.com/about/TodayInNYSE.html


1834: With Pres. Andrew Jackson seeking to dissolve the Bank of the United States, Wall Street tanks. Shares of the blue-chip Delaware & Hudson Canal close the day at $73, a 20% loss in just two weeks.

James K. Medbery, Men and Mysteries of Wall Street (Fields, Osgood & Co., Boston, 1870; reprinted, Fraser Publishing Co., Wells, VT, 1968) p. 294.


1792: Today is the birthday of the dollar sign ($), as it shows up for the first time on a federal document — a U.S. Treasury bond issued to George Washington.

Rags to Riches: The Financing of America, 1776-1836 (Museum of American Financial History, New York, 1998), p. 8.

Posted in Equity, This Day In Financial History, Uncategorized | Tagged | Leave a comment

Our Autopsy On The Still Living Bear Market

Summary

  • We believe the market is way off base in its analysis of what caused stocks to sell hard in 2018
  • The U.S. and world have a debt problem and yields need to mover higher in order for markets to clear
  • The breakout in long-term yields in late September broke the U.S. stock market
  • The macro factors that caused the stock market collapse, the changing dynamics in the Treasury market,  have not changed and are likely to deteriorate further
  • A volatile future is highly likely
  • Timing to be determined

Is that it?

The end of the bear market?

Autopsy in the above title is a misnomer.  We believe the bear is not quite dead yet.

Moreover, what was it that caused stocks, the S&P500,  to sell off 20.21% in just 66 trading day?

We don’t claim to have the Truth, nor does anyone else,  but what we do have, is what we believe to be a well researched, thought out alternative and provocative opinion, based on empirical data, and proud to say far from the conventional wisdom of the market.  That is, that stocks sold off over worries of a potential monetary policy mistake and an imminent recession — total nonsense, in our opinion.

The Market Now Believes The Fed Has A New Dual Mandate

Furthermore, what a disgrace it was to watch the market clowns and cheerleaders try to force — and now believe they have succeeded —  Jay Powell and the FOMC to change their “dual mandate” from price stability and maximum employment to supporting the S&P500 and Nasdaq.  Total yuck!

Spoiler alert.  We estimate the Fed will still reduce the balance sheet by $17 billion in January; $46 billion in February;  $34 billion in March, and the Fed Funds target range will remain at 2.25-2.50 over the same period.

No change in policy, but some soothing words from Mr. Powell that the FOMC will remain flexible and data dependent.

Baffling.  When in the hell has the Fed not been flexible and data dependent?

The Fed Put

The cheerleaders are happy, nonetheless, as they believe the Powell Fed is now the stock market’s bitch.   We are not so sure.

Jay Powell appears, at least to us, to be one cunning and smooth operator.  That Fed put you perceive lurking down 10 percent is no more real than the illusion of Mexican pesos flowing into the Treasury coffers to pay for that  “f%#ken Wall.”

If it soothes the market’s soul to believe in such a fantasy, so be it.

Party Rally on, Garth!

The Origins Of The Bear Market

We believe the 2018 global bear market began with the massive volatility spike which started at the end of last January.

We believe there will be a stock bear market in 2018 but less confident on its depth and length, however.   We will turn that page, if, and when, we get there.

Recall in our earlier posts (see here and here), there have been three other massive volatility shocks since 1950,  similar to the one the S&P500 just experienced.

1) 1955: Ike’s heart attack;  2) 1962:  the “Kennedy slide” or JFK bear market; and 3) 1987:  the “crash” bear market, which lasted only 38 days.

We threw out Ike’s heart attack as it was not a prelude to a bear market.  The S&P500 recovered shortly after the sharp Monday sell-off after President Eisenhower had a heart attack on the 8th hole at Cherry Hills Country Club the prior Saturday afternoon.

Bear Markets Do Not Happen Without Recession?

To that, we say, poppycock!  Time to tune out the cheerleaders.

The data are clear.  The U.S. economy thrived during the 1962 bear market, growing at more than 6 percent, on average.  The economy grew at 3 ½  percent in 1987.   No recession, not even close, in those two bears.  – GMM, Feb 21, 2018

Yes, the S&P500 did make a nominal new high in September, which turned out to be a very ugly bull trap.  Not so for most other markets.

The 2018 Sell-Off Was Different

We also noted last year how the big spike in volatility and massive selling was different than past corrections.

Here’s an excerpt from our post, Why This Correction Is Different,

The sell-off that began on January 29th spanned ten trading days and took the S&P500 down 10.2 percent (11.8 percent from intraday high to low), and was the first correction this century that corresponded with a rise in the 10-year Treasury yield.   That is a positive correlation between stocks and bonds to the downside during an official correction.

Moreover, the table below shows there has been only one other correction or bear market in almost 30 years that has seen the 10-year Treasury yield rise.  The correction in 1999 and 41 bps move higher in bond yields was the result of the Fed and market yields rebounding from the sharp drop and overshoot in interest rates during the Russian debt default and LTCM crisis in 1998. – GMM, March 18, 2018

Thus began our laser focus on bond yields and the changing dynamics of the Treasury market.

The Gathering Storm In The Treasury Market

On September 24th, we posted our 5,000 plus word tome,  The Gathering Storm In The Treasury Market, the very day the S&P500 peaked at 2940.91, its all-time high.

In addition to the massive increase in the supply of  Treasury securities hitting the market,  we noted several structural factors on the demand side that are changing.

  • The massive borrowing by the U.S. Treasury is crowding out emerging market capital flows
  • The structural factors that have kept long-term interest rates low and term premia repressed are fading
  • The U.S. budget deficit is exploding
  • The Treasury has to increase its market borrowing as the Fed rolls off its SOMA Treasury portfolio
  • Social security has moved into deficit and borrowing from its trust funds to finance on-budget deficits is over
  • Globalization is under threat, and foreign capital flows into the U.S., particularly the Treasury market, are declining  – GMM,  September 24, 2018

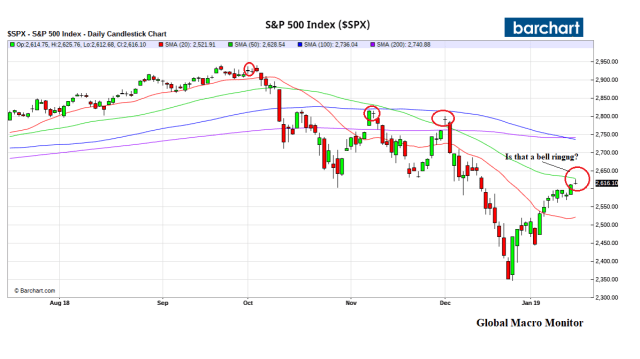
The yield on the 10-year Treasury soon broke out to 3.25 percent, a level not seen since 2011, which, as the chart below illustrates, broke the stock market.

Mr. Market Can Stand Many Things, But Can’t Stand Higher 10-Year Yields 

Given the unprecedented increase in Treasury supply during an economic expansion, coupled with the changing structural demand factors we cited, we concluded a move to over 4 percent and quickly was a done deal.  Unless however,

All bets off given a geopolitical shock — we are concerned how quickly U.S.-China relations are moving south;  a collapse in stock prices,  or a sharp slowdown in economic activity.   Haven flows will likely swamp the structural factors pressuring  yields higher.  – GMM, September 24, 2018

Upshot

There you have, folks.

The stock market broke as long-term yields broke out to 8-year highs.  All while the cheerleaders were claptrapping, “interest rates are moving higher for all the right reasons. Stocks are cheap, buy ’em.”  What horseshit as I used to say during my baseball days.

No monetary policy mistake.  No global recession.

Furthermore, it’s totally absurd, in our opinion, to think a move from a negative 2 percent real Fed funds rate to zero or barely positive in an economy with sub-4 percent unemployment can lop 20 percent off the U.S. stock market.   We will concede, however,  markets often ignore levels and obsess more over first and second derivatives.

Haven Flows And Bond Bears Pile Into Treasuries

As stocks collapsed, haven flows did swamp the negative structural factors, as we expected.  In addition, the global macro stock bears piled into bonds as their instrument of choice to get short stocks, driving the 10-year yield down to 2.55 percent on the second trading day of the year.

Conclusion

We are beginning to suspect the global markets are experiencing an evolving epiphany that the world has a debt problem and real yields need to go higher for the Treasury market to clear.  However, because of the extremely elevated level of asset prices, including stocks and housing, fundamental valuation (discounted cash flows) dictates that prices must move lower with higher interest rates.

In our “new economy” which is so dependent on asset prices — go no further than the beating Jay Powell just took — we are not so sure the bond market can clear at a much higher equilibrium real yield.

If that’s the case, then as, or if,  markets grow more confident, stock bears sell their bonds, and the haven flows continue to move out of Treasuries and back into risk assets, yields should move much higher and faster than expected.  Up to a tipping point level where asset markets sell-off hard again.

Too much debt has become the asset markets’ governor.

The Treasury may only be able to fully finance the shortfall in demand from natural buyers with haven flows.   Ergo softer risk markets.

We could be wrong, reserve the right to be, and will change as the facts change.

Keep our alternative perspective on your radar.

debt_s&p500_3


debt_s&p500


debt_s&p500_2

Help keep the lights on at the Global Macro Monitor.   Contribute any amount based on your perception of our value added by clicking the PayPal donate widget at the right side of the screen.  Thank you!

free rider_2


Posted in Bonds, Equities, Uncategorized | 16 Comments

S&P500 Key Levels & Gravestone Doji

Today’s price action and candle look sound as closest like a bell ringing to sell the S&P as you are going to get.   Yes, we jumped the gate a bit early in our recent short and are very cognizant the market psychology has changed but this is a set-up we cannot pass on.

Today’s price action rejected the S&P very close to the 50-day and generated a gravestone Doji candlestick, which have signaled a short-term top.

The overnight futures are a bit underwater but we will be looking to get short on any pop.  We have a limit order to sell 5 contracts at 2618 with a stop 2645.  Note 2643 is the .50 retracement of the current bear market.  If we get stopped out and lose money on this trade, we will have to reassess our market view.

May have to sell lower, however.  Wish us luck.

sp_chart


sp

Posted in S&P500, Trades | Tagged , , | Leave a comment

QOTD: John Bogle, RIP

Trees don’t grow to the sky, and I see clouds on the horizon. I don’t know if and when they’ll arrive. A little extra caution should be the watchword – John Bogle, Barron’s – December 28, 2018

Posted in Quote of the Day, Uncategorized | Tagged , | Comments Off on QOTD: John Bogle, RIP

This Day In Financial History – Jan 16

From the great Jason Zweig

January 16:

1991: The Persian Gulf war begins (at 7 p.m., Eastern Time) as the U.S. transforms Operation Desert Shield into Operation Desert Storm by launching its aerial bombardment of Baghdad and Kuwait.

http://www.defenselink.mil/news/Aug2000/n08082000_20008088.html;

http://www.desert-storm.com/War/chronology.html


1974: The New York Stock Exchange’s systems are so primitive that a single computer glitch at Merrill, Lynch & Co. delays the opening of the trading day by a full 15 minutes.

Today in NYSE History, at www.nyse.com/about/TodayInNYSE.html

Posted in Equity, This Day In Financial History, Uncategorized | Tagged | Leave a comment

Perspective In The Permian

For a bit of perspective, the entire state of California, which recently beat out the United Kingdom as the fifth biggest economy in the world, has around 10 active drilling rigs. The Permian Basin alone has nearly 500. Exxon Mobil and Chevron, the United States’ top energy moguls, have both made the Permian Basin their focus, prioritizing their investments in West Texas over all their other projects worldwide, while European supermajors including Royal Dutch Shell and BP are also working diligently on growing their presence in the Permian. – Oilprice.com

Posted in Crude Oil, Uncategorized | Tagged , , | Leave a comment