
-
In economics, things take longer to happen than you think they will, and then they happen faster than you thought they could.
-
Join 1,086 other subscribers
Contribute To GMM

Categories
- 3D Printing
- Agriculture
- AI
- Algos
- Apple
- Automation
- Banking
- BFTP
- Bitcoin
- Black Swan Watch
- Bonds
- Brazil
- Brexit
- BRICs
- Budget Deficit
- Capital Flows
- Cartoon of the Day
- Cashless Society
- Chart of the Day
- Charts
- China
- Clean Tech
- Climate Change
- Coach C
- Commodities
- Coronavirus
- COVID
- Credit
- Crude Oil
- Currency
- Cyprus
- Daily Risk Monitor
- Day In History
- Debt
- Demographics
- Disinflaton
- Dollar
- Earnings
- ECB
- Economics
- Economist
- Egypt
- Electric Vehicles
- Emerging Markets
- Employment
- Energy
- Environment
- Equities
- Equity
- Euro
- Eurozone Sovereign Spreads
- Exchange Rates
- Fed
- Finance and the Good Society
- FinTech
- Fiscal Cliff Monitor
- Fiscal Policy
- Food Prices
- France
- Futurist
- Game Theory
- General Interest
- Geopolitical
- Geopolitics
- German Bund
- Germany
- Global Macro Watch
- Global Reset
- Global Risk Monitor
- Global Stock Performance
- Global Trend Indicators
- Gold
- Greece
- Healthcare
- Heat Map
- Hedge Funds
- Housing
- Human Interest
- Immigration
- Impeachment
- India
- Inequality
- Inflation/Deflation
- Infographics
- Innovation
- Institutional Investors
- Interest Rate Monitor
- Interest Rates
- Interviews
- Italian Yields
- Italy
- Japan
- Jobs
- Lectures
- Macro Notes from Conference Calls
- Manufacturing
- Masters
- Mexico
- Monetary Policy
- Movies
- Muni Bonds
- Muni Market
- Natural Gas
- News
- Nonlinear Thinking
- North Korea
- Overbought Markets
- Picture of the Day
- PIIGS
- PMIs
- Policy
- Politics
- Population
- Populism
- Poverty
- President Trump
- Qunat Strategies
- Quote of the Day
- Quotes
- Rare Earth Elements
- Readership
- Reads
- Real Estate
- Relative Strength Index
- Robert Shiller
- RSIs
- S&P500
- Sector ETF Peformance
- Semiconductor prices
- Semiconductors
- Social Media
- Socialism
- Song for the Week
- Sovereign Debt
- Sovereign Risk
- Spain
- Sports
- State and Local Government
- Tail Risk
- Technical Analysis
- Technology
- The Big Reset
- The Weekend Read
- This Day In Financial History
- Trade War
- Trades
- Tweet of the Day
- Ugly Chart Contest
- Uncategorized
- US Releases
- Video
- Volatility
- Wages
- Week Ahead
- Week in Review
- Weekend Reads
- Weekly Eurozone Watch
- Whales
-
Recent Posts
Meta
Ownership And Profile Of The Corporate Bond Market
Summary
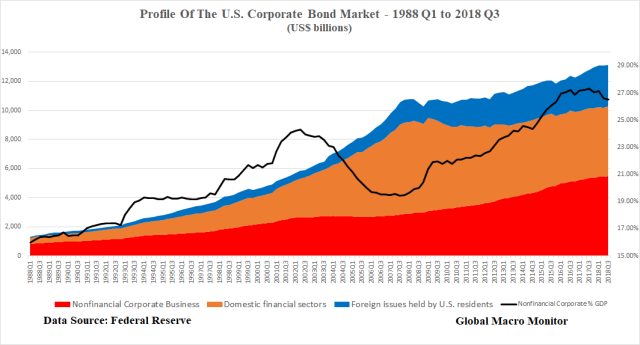
- Nonfinancial corporates have amost doubled their stock of outstanding bonds since the GFC moving from 19.5 percent of GDP in 2007 to 26.5 percent in Q3 2018
- Conversely, the domestic financial sector has been delevering, reducing bond debt by almost 25 percent since 2007, which reduces systemic risk
- Foreigners are by far the largest holders of U.S. corporate bonds and, we suspect, the weakest hands
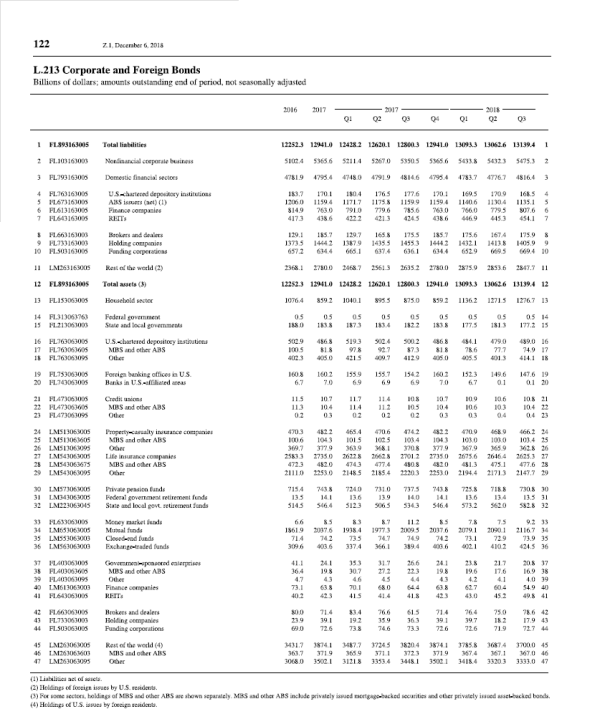
We spent most of the day crunching numbers on the U.S. corporate bond market as stocks went on another roller coaster ride. Given all the hand-wringing and concern over the buildup of corporate debt since the Great Financial Crisis (GFC), we have a real need to see and understand the data.
The Data
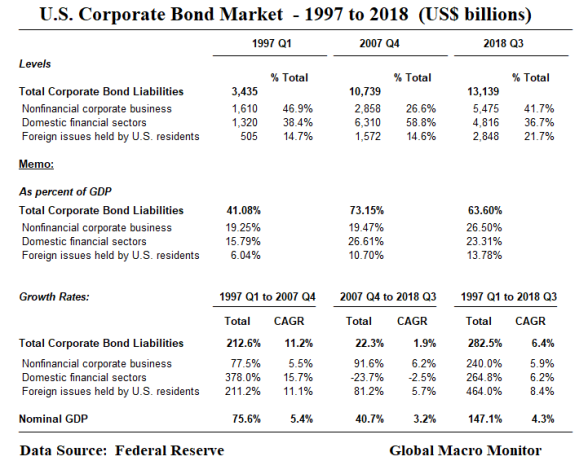
We look at the changes in level, profile, and ownership of the corporate bond market over two different periods with the Fed’s Flow of Funds data. Our point of reference is Q4 2007, which was not only the end of the early century bull run in stocks and beginning of the GFC but also the quarter where nonfinancial corporate debt as a proportion of the corporate bond market was at its lowest (26.6 percent).
Fast forward 43 quarters to Q3 2018, the latest available data, and lag back 43 quarters from Q4 2007 to Q1 1997, and there you have our three points of measurement.
Conclusions/Data Inferences
1997 Q1 to 2007 Q4
- The data illustrate the massive build in leverage in the domestic financial sector from 1997 to 2007, which was the primary cause of the GFC. Domestic financial sector bond debt grew by 378 percent over the period, increasing at a compounded average growth rate of 15.7 percent, to almost 60 percent of the market.
- The stock of nonfinancial corporate bonds grew at a more modest CAGR at 5.5 percent during the same period, right in line with nominal GDP growth.
- Foreign issues in the U.S. experienced significant growth though from a small base.
- Overall corporate bond debt to GDP grew from 41.08 percent of GDP in 1997 to 73.15 percent by Q3 2018.
- Foreign issues should be excluded from the bond debt-to-GDP ratio to gain a better measure of the true debt burden on the U.S. private sector.
2007 Q4 to 2018 Q3
- The U.S. domestic financial sector has been deleveraging since the GFC, reflected in the negative 23.7 percent growth rate in the sector’s bonds outstanding.
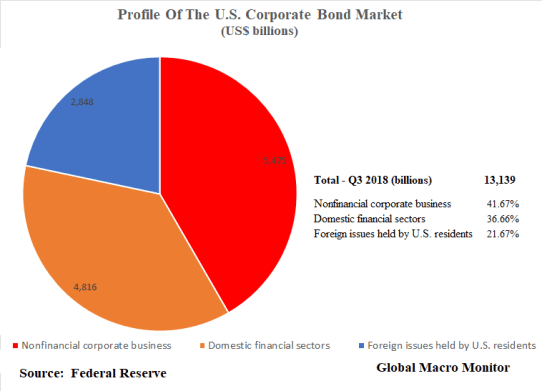
- Conversely, nonfinancial corporates have grown their bond debt by over 90 percent to 42 percent of the corporate bond market and 26.50 percent of GDP, up from 19.47 percent in 2007.
- Nonfinancial corporate bonds now make up the most significant percentage of corporate bonds outstanding in the U.S. and, by extension, now the biggest
- The diminishing liquidity, or lack of traditional market makers, magnifies the risk of an outsized dislocation in the sector. Though not on such a massive scale, the buildup in nonfinancial corporate bond debt since 2007 mirrors that of the financial industry from 1997 to 2007.
Who Owns The Corporate Bond Market
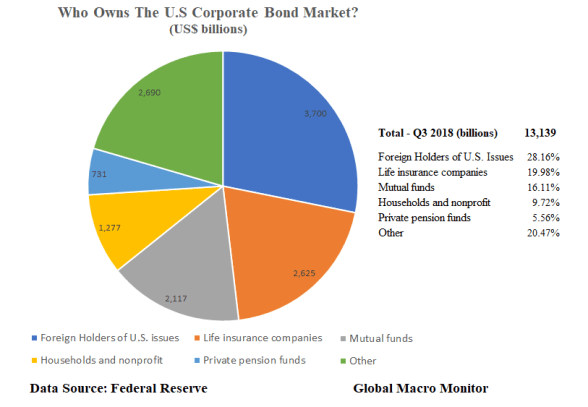
- Foreign holders of U.S. corporate bonds make up the largest ownership group subjecting the market to capital flight risk, which, in other countries, is often sparked by domestic political instability. Watch this space.
- Life insurance companies are the most significant domestic holders of corporate bonds, taking down almost 20 percent of outstandings.
- Mutual funds are a close third followed by households, which include hedge funds.
- Other makeup over 20 percent of corporate bondholders but each group is less than 5 percent of the market. They include state and local employee pension funds, banks, state and local governments, broker-dealers, ETFs, closed-end funds, among others.
- The largest hands – foreign holders – are most likely the weakest hands. Another risk not even close to the radar of most traders and investors.
Upshot
You now have the data and charts, folks. Short and sweet, easy to read.
Now you have knowledge and can’t claim you were unaware of the risks if the GE refrigerator falls through the kitchen floor.
Data Source
Help keep the lights on at the Global Macro Monitor. Contribute any amount based on your perception of our value added by clicking the PayPal donate widget at the right side of the screen. You don’t need a PayPal account just a credit card. Thank you!

Divining POTUS Tweets
The new haruspicy.
What keeps a short seller up at night? What else? POTUS tweets!
Is this a signal he is ready to cave on the shutdown?
I look forward to giving a “great” State of the Union Address in the near future.
“Near future?” The March S&P e-mini?
Great? Good? Goodbye? Lie? Buy? BUY! BUY! BUY! BUY!
This is Kafkaesque, folks! True Kafka. Not just for traders but for the Whole Freaking World.
S&P500 Short: Update
Selling 5 contracts at the open of the overnight session. Back to you with levels.
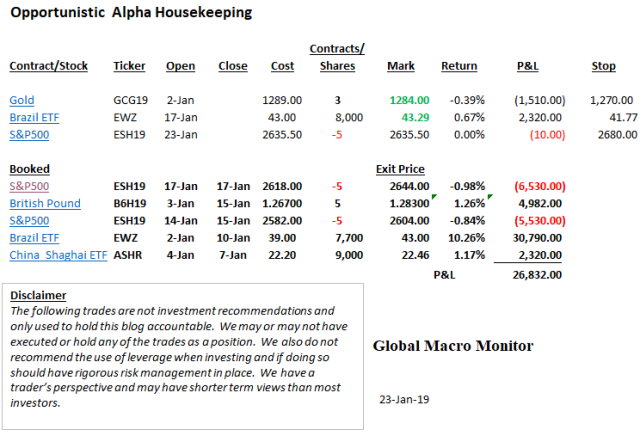
Update: Sold 5 March S&P e-minis at 2635.50. Stop at 2680.00.
Comment: Looks like good news on China deal is pushed out, less of a tape bomb risk and increasing probability that negotiations could go sideways. The admin loses cred everytime they trot out Kudlow to goose the market.
The temperature is heating between Trump and the Dems, which we are betting may spook the market. Could just be posturing ergo be careful of tape bombs in the form an olive branch after tomorrow Senate votes. Trump has backed himself into a corner a needs a way out as his polls numbers are dropping like a stone.
The Chinese are watching.
Staying flexible. Nervous there are too many bears roaming the market and some decent chip earnings. Intel big after close tomorrow.
Didn’t like selling in the hole, down 3 1/2 points below the fair-value close, but could get some ugly headlines overnight. Or, maybe not.
Brazil continues to trade well, gold doing nothing, and the British Pound got away from us.
Hope you stayed long, now trading with a 1.31 handle, up over 3.5 percent from the original entry.
Do as we say, not as we do.
Getting Short S&P500
Selling 5 contracts at the open of the overnight session. Back to you with levels.
Posted in Uncategorized
Leave a comment
Reskilling The American Workforce
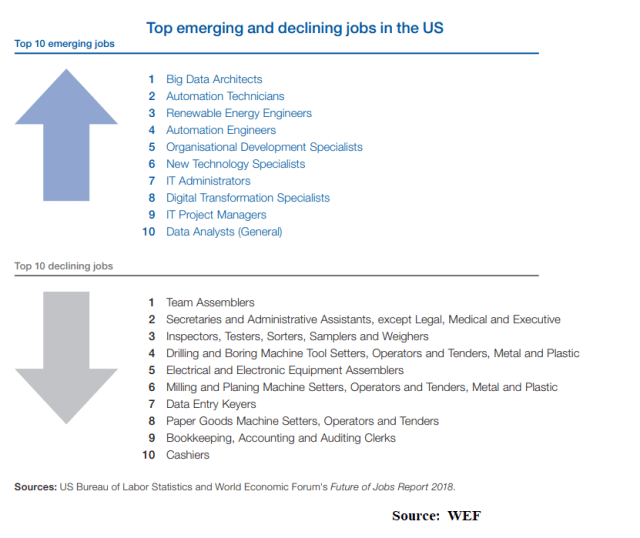
The future is here, folks.
We better start thinking big and bold, beginning with huge investments in human capital. A new Marshall Plan for the American educational system.
Python is not a difficult coding language to learn and the basics should be mandatory learning by the fourth grade.
Help keep the lights on at the Global Macro Monitor. Contribute any amount based on your perception of our value added by clicking the PayPal donate widget at the right side of the screen. You don’t need a PayPal account just a credit card. Thank you!

Posted in Employment, Technical Analysis, Uncategorized
Tagged Reskilling the American Workforce, Technology jobs
1 Comment
This Day In Financial History – Jan 23
From the Great Jason Zweig
January 23:
1987: Daily trading volume on the New York Stock Exchange exceeds 300 million for the first time, as 302.4 million shares change hands.
Museum of American Financial History; http://www.nyse.com/marketinfo
1932: The Reconstruction Finance Corp. is created under a law signed today by Pres. Herbert Hoover. The RFC, funded with $1.5 billion, lends aggressively to faltering railroads and banks, as well as to municipalities seeking to finance relief programs and public-works projects. But it’s just a drop in the bucket of the Great Depression.
Barrie A. Wigmore, The Crash and Its Aftermath: A History of Securities Markets in the United States, 1929-1933 (Greenwood Press, Westport, CT, and London, 1985), p. 311.
Global Risks 2019 – World Economic Forum
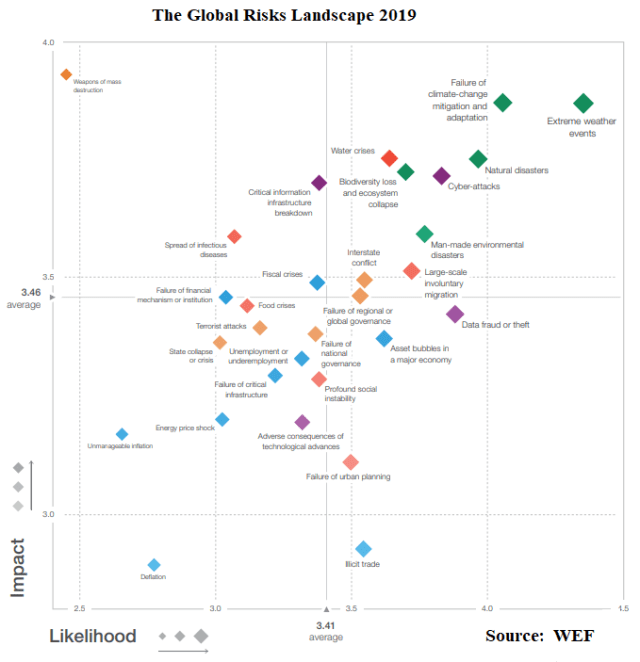
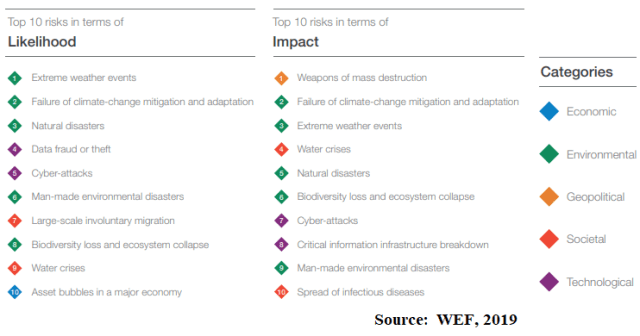
Nice chart and table of what the World Economic Forum (WEF) deems as the major risks with their respective probabilities for the coming year. Environmental, global warming and cyber are the most likely high impact events, complicated by a backdrop of rising nationalism and fading global cooperation.
Is the world sleepwalking into a crisis? Global risks are intensifying but the collective will to tackle them appears to be lacking. Instead, divisions are hardening. The world’s move into a new phase of strongly state-centred politics, noted in last year’s Global Risks Report, continued throughout 2018. The idea of “taking back control”— whether domestically from political rivals or externally from multilateral or supranational organizations— resonates across many countries and many issues. The energy now expended on consolidating or recovering national control risks weakening collective responses to emerging global challenges. We are drifting deeper into global problems from which we will struggle to extricate ourselves. – The Global Risks Report 2019
The term “sleepwalking” makes us very nervous.
Usually pays to bet against the prevailing narrative of the January Davos event.
Help keep the lights on at the Global Macro Monitor. Contribute any amount based on your perception of our value added by clicking the PayPal donate widget at the right side of the screen. You don’t need a PayPal account just a credit card. Thank you!

S&P500 Key Levels
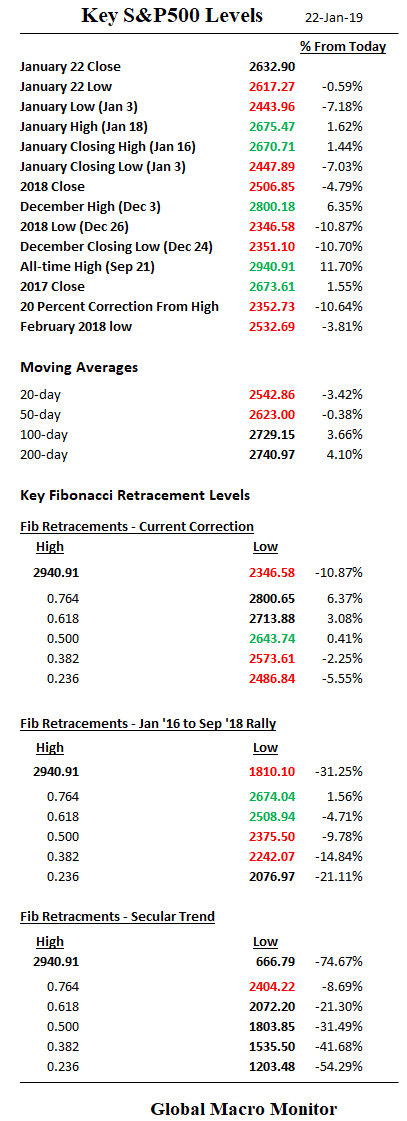
The S&P gave up 22 percent of its 6.54 percent YTD gain today.
We nailed it in our 3 AM post, The Increasing Risk of A Major China Trade Debacle,
Look to the government shutdown as your template as to how Trump & Co. have painted themselves into a corner with potentially disastrous consequences.
We know the president has trouble with the public perception that he has “caved,” which now raises the risk of a complete debacle and sharp market sell-off. — GM
The administration trotted out Larry Kudlow with the Dow down over 400 points today. We think this weakens the administration’s negotiating position as China clearly understands Trump can’t stand a bear market and is obsessed with every 10 point move in the S&P.
Moreover, Xi and China play the long game and are not obsessed with every tick in the Shanghai and oversee a command economy not subject to market discipline.
We fear that Trump is painting himself into a corner and is one who can’t appear to have blinked. The Chinese can delay and wait for another 10 percent flop in the S&P and bet Trump caves.
That makes for some unstable nonlinear dynamics.
Uninvestable and hard to trade, unless it’s scalping.
We’ve been burnt twice on the “fake” tape bombs of an imminent trade deal. We are waiting and watching.
A test of the December low? Moreover, then some.
Key Levels
The marker is on the upside with Thursday’s high at 2675.47.
The first level of support down is the 50-day at 2623.00, which broke but managed to claw back and retake it at the close. We are looking at 2594.40 as a new Fib retracement, which needs to hold for this rally to remain intact.
Stay tuned.

Help keep the lights on at the Global Macro Monitor. Contribute any amount based on your perception of our value added by clicking the PayPal donate widget at the right side of the screen. You don’t need a PayPal account just a credit card. Thank you!
 Global Macro Monitor