Wow! In the words of Zero Hedge, “bizarro.”
Zero Hedge, who has some very smart Tylers and are always kind enough to post many of our pieces, is out with a post yesterday, JFK vs Trump: The Most Bizarre S&P Analog Is Confounding Traders,
Money Quotes:
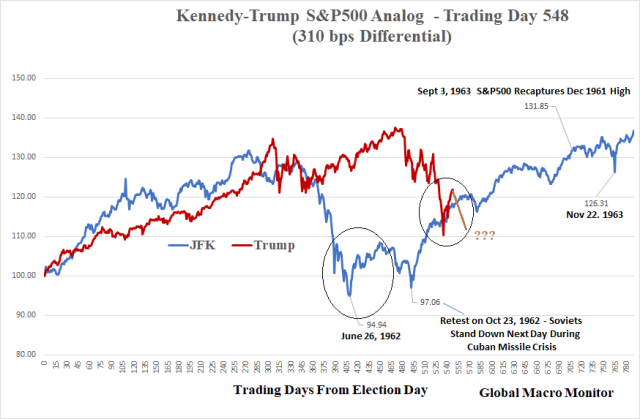
- Last March, we [Global Macro Monitor] told readers that they need to “sit down” for what we are about to show: a chart showing the indexed “analog” performance of the S&P since the election of presidents JFK and Donald Trump. What the chart showed, is that as of March 15, 2018 the “analog” was only three bps apart on Day 338 after election day, or just a one S&P500 point difference.
- Commenting on the chart above, we said that it was “now make or break time for the analog”, adding that “if it is a true tracker, the S&P500 should rollover hard” soon.
- In retrospect it took a little longer, but the S&P indeed resumed tracked the “JFK” analog almost tick for tick, to the point where Goldman chief equity strategist David Kostin overnight pointed out the uncanny resemblance of the (indexed) S&P under Trump vs under JFK. – Zero Hedge
Goldman, almost a year after our analysis, no doubt (we think, haven’t seen their piece) without attribution, finally catches on. Better late than never!
Jan-Feb 2018 Vol Shock Kicks Off The Current Bear Market
The Global Macro Monitor noted the very rare volatility shock that began at the end of last January, which happened only three times in the post-War markets. It looked very much like January 1962 vol spike that kicked off the “Kennedy slide.” We thus began tracking the two S&P’s and developed the JFK-Trump S&P500 analog.
We were also one of the chosen few that proclaimed early in 2018 stocks were in a bear market. We received tremendous pushback and mockery over our call and the JFK-Trump analog. But you know what Einstein says about that, folks!
After the two S&P time series diverged by 10 percent, we put it on ice for a while.
Global Macro Monitor – “A Must Read”
This is why the Global Macro Monitor is a must read. We don’t fly with the pack of geese; always provide an alternative and very provocative perspective; contrarian and often skeptical of the conventional wisdom; not afraid to be wrong; not afraid to admit we wrong, which is often; think outside the box; have zero conflicts of interest; don’t wear pom-poms and cheerleader skirts, and provide you with concrete and specific ideas to monetize what you read.
Background On the JFK-Trump S&P Analog
Last February we posted,
Historic Volatility Spike
Only three times since 1950 has intraday volatility jumped so high as measured by a modified version of the Average True Range: 1) September 1955 after an extraordinarily period of calm the S&P500 tanked on September 26th when markets opened after President Eisenhower’s heart attack on the 8th hole of Cherry Hills Country Club over the weekend. The market quickly recovered; 2) January 1962 when the “Kennedy slide” began to accelerate; and 3) the October 1987 stock market crash.
Kennedy-Trump S&P500 Analog
This market is starting to look very similar to the JFK post-election rally, top, and bear market, which eventually bottomed when Khrushchev backed down during the Cuban Missile Crisis. We will post more on the JFK-Trump S&P500 analog later in the week. – GMM, February 11
We followed it up with several posts, here, here, here, and here.
And with several of these charts,

We also listed our reasons why the two S&P’s were tracking so closely.
Our good friend down under, Greg McKenna wants to know,
Why The Analog Works
We believe this analog is working for the following reasons:
- Tracks a political cycle after the election of a new president;
- Both S&Ps had similar big moves in a relatively short-period after election day: JFK–30.1 percent, 285 days; Trump–34.8 percent, 306 days.
- Both bull moves were led by tech stocks, which resulted in extreme valuations: JFK: Texas Instruments and Polaroid (see Zweig comments below); Trump – FANG.
- Both markets have similar domestic and geopolitical headlines: Steel, nukes, and increased cold war/Russia/China tensions;
- Both have a similar macro story – inflation concerns morphing into a growth scare.
- Today’s machine learning/AI algorithms search for such patterns and trade on them.
- Both President Kennedy and President Trump did, and will, celebrate Easter Sunday in Palm Beach. Yikes! That is downright scary!
The most important, in our opinion, is #2 – the percentage move and time frame.
Bear markets always follow bull markets and the bigger the prior move in a compressed time frame, the harder the fall. Bear markets look for catalysts to sell, but the underlying vulnerability remains — valuation and longer-term overbought conditions.
Expecting A Few Flash Crashes
We are also expecting a few flash crashes during the next few months. – GMM, March 27, 2018
Add also similar Russians 24/7, and run don’t walk to see #1 in our 2019’s Five Most Mispriced Tail Events. Yikes!
MarketWatch was all over the analog early on. Replace weeks with months and Shawn‘s piece totally nailed it.

There you have it, folks. we were way ahead of the flock, and why the Global Macro Monitor is a must read!
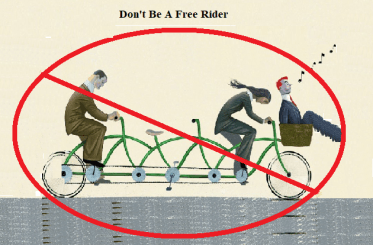
We don’t want to sound like a TV evangelist but also another reason why not to be a free rider. We know for a fact some of our readers made a ton of money trading the JFK-Trump analog.
We rejected a firewall subscription model because our friends in the weak currency emerging market countries found the monthly nut prohibitive. In fact, some of the countries even prohibit PayPal due to capital controls.
Help keep the lights on at the Global Macro Monitor.
Contribute any amount based on your perception of our value added by clicking the PayPal donate widget at the right side of the screen. Thank you!