The EV Industry And The Global Nickel Shortage

#CKStrong

Posted in Uncategorized | Leave a comment

Where does China stand on the Russia-Ukraine war?

#CKStrong

Excellent synopsis.

Posted in Uncategorized | 1 Comment

What Oil Crisis?

#CKStrong

Crude oil prices are back down to where they were on Valentine’s Day, more than a week before the invasion of Ukraine.  It’s still early in the crisis so beware of complacency.  

Futures traders/speculators, who drive short-term commodity prices often get the cash market equilibria wrong, which causes, in part, the excessive volatility.  If Russia sells their oil to China, doesn’t China’s demand for other sources of crude oil fall?  Commodities live in a fungible albeit, sometimes, fuzzy general equilibrium.

Wheat Prices

Wheat is the chart that worries us.  Rising wheat prices can spark global food riots.

The head of the United Nations warned Monday that Russia’s assault on Ukraine is pushing the global food system to the brink of disaster as wheat prices skyrocket and key supply chains are thrown into chaos, threatening a hunger crisis in Europe and well beyond.

“Russia and Ukraine represent more than half of the world’s supply of sunflower oil and about 30% of the world’s wheat,” U.N. Secretary-General António Guterres said in remarks to the press in New York City. “Ukraine alone provides more than half of the World Food Programme’s wheat supply… All of this is hitting the poorest the hardest and planting the seeds for political instability and unrest around the globe.” – Truthout

Wheat

Posted in Uncategorized | Leave a comment

OOTD: Taiwan Semi & The “Broken Nest” Strategy

#CKStrong

See our post, Straight Flush: The Taiwan Straight Beats The Straight Of Hormuz, for some context. 

..the reliance on TSMC [Tawain Semiconductor] is the core concern: an invasion of the island by China would leave the world’s most advanced chips in the hands of Beijing. U.S. academic Jared McKinney recently suggested in a U.S. Army journal that Taiwan should protect itself by threatening to destroy chipmaking facilities so that Beijing would see its tech industry “immobilized” should it invade. He called it a “broken nest” strategy.  – Bloomberg

Posted in Uncategorized | Leave a comment

Today’s Inflation Rate And Nolan Ryan’s Fastball

#CKStrong

The 1970s Inflation Is Back – But Not Officially

In 1983, the Bureau of Labor Statistics (BLS) made a change to an integral component of inflation indexes. The adoption of owners’ equivalent rent (OER) to estimate shelter costs meant home purchases would no longer be considered a consumption expenditure but instead a capital asset or investment. OER is determined by a monthly survey of consumers who own a primary residence. The survey asks how much consumers would pay to rent instead of own their home. OER represents approximately 25% of the Consumer Price Index and 12% of personal consumption expenditures (PCE). – Penn Mutual

Aroldis Chapman v Nolan Ryan’s Fastball

We’ve been asked on several occasions if the current outbreak of inflation will compare to the 1970s (see our post, Feels Like 1977)?  

We usually respond with a rhetorical baseball analogy that goes something like this,

Who’s fastball had more velocity in their prime:  Nolan Ryan or Adoldis Champman?

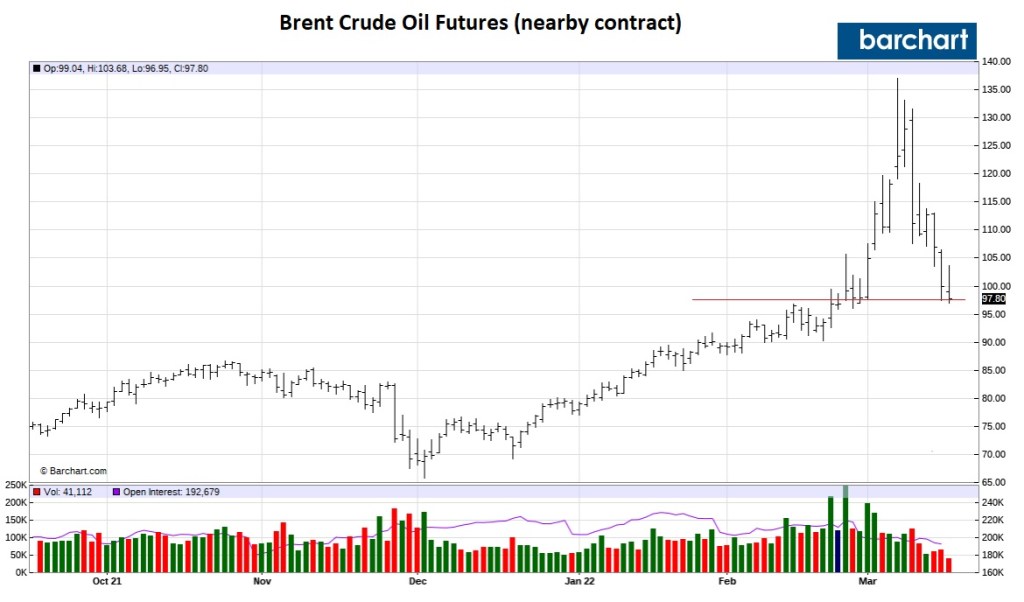
Most answer, “obviously, Chapman’s, the radar gun doesn’t lie, it clocked his record fastball at 105.1 mph in 2010!  Nolan Ryan was clocked only at 100.9 mph in 1974.

We then counter with this,

It all comes down to where the pitch is measured.

The moment a baseball leaves a pitcher’s hand, it starts to slow down because of drag. According to University of Illinois physicist Dr. Alan Nathan, a pitch that leaves a pitcher’s hand at 100 mph will (at sea level) slow down by 9 to 10% by the time it crosses the plate some 55-58 feet later.

So that 100 mph pitch could be measured at 100 mph (at the pitcher’s hand), 99 mph (at 50 feet from home plate), 94 mph (midway on its journey) or 91 mph (as it crosses home plate)—the rate of decrease varies based on atmospheric pressure, so a pitch at the altitude of Denver’s Coors Field slows less than a pitch at Tropicana Field in St. Petersburg, Fla.

…  The first radar guns that began appearing at ballparks in the late 1970s and early 1980s measured pitches much closer to the plate.

… So when you read of 85-90 mph fastballs from the early 1980s, realize that they would be registering much faster with current measurement tech. An 85 mph fastball (if registered by a Speedgun at the plate) would be roughly 93 mph if measured by Statcast out of the pitcher’s hand.

And that makes the 100 mph pitches Nolan Ryan threw in 1974 (as measured by Rockwell laser/radar instruments relatively close to the plate) even more remarkable today. – Baseball America

Do the math, folks, after normalizing the data to a standard measurement, add another ten mph to Ryan’s fastball, and you get  a velocity of 110 mph.  Back to the 1970s.   

The CPI of 2022 Is Not The CPI  Of The 1970s

Most our readers have heard our sermon on this topic many times but it bears repeating.

As Ryan’s fastball can’t be compared to Chanpman’s, so too it is with the comparative inflation data. 

To paraphrase the above,

It all comes down to how inflation is measured.

In 1983, the BLS switched to a shelter measurement in the CPI basket, 33 percent of the CPI basket based on survey data, the based owners equivalent rents (see Appendix) . The old measure pre-1983 was calculated based on the net acquisition approach (see Appendix), the cost of buying a new home measured by, including, among other things, by actual house prices and mortgage rates.  

The post-1983 measure, Owners Equivalent Rent (OER), is based on these monthly surveys sent out to homeowners,

If someone were to rent your home today, how much do you think it would rent for monthly, unfurnished and without utilities? – BLS

We get the BLS’s academic argument of separating housing as an investment good and housing as a consumer service, but the OER measure grossly understates the cost of shelter and inflation. 

It is also fatally flawed because marginal buyers always set prices in all markets. Taking the average survey data is far from marginal pricing.     

The following chart illustrates our point and the absurdity of the BLS measure of shelter.

This image has an empty alt attribute; its file name is aburd_oer-2.jpg

The change in the OER, almost 25 percent of the CPI basket, was up a measly 3.8 percent in 2021 versus the 25.7 percent increase for a standard fixed-rate mortgage payment. The data are based on a conventional 30-year fixed-rate mortgage, up 44 bps in 2021, and the average home price increase of 18.8 percent as measured by the National Case-Shiller National Home Price Index.    

It’s hard to believe the Fed just stopped buying mortgages.  Irresponsible and reckless monetary policy. 

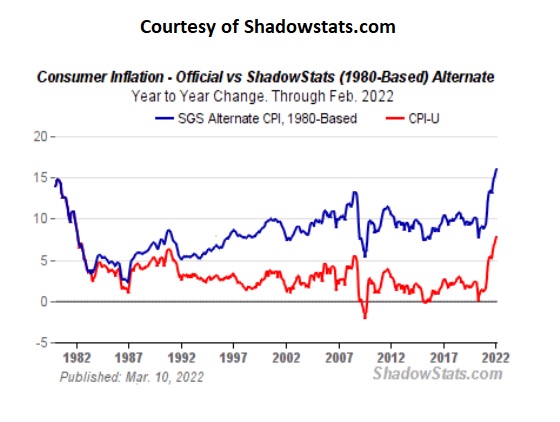
ShadowStats does an excellent job of normalizing and retrofitting the inflation data to its original measure using the net acquisition approach (see appendix) and comparable to the pre-1983 CPI.

This image has an empty alt attribute; its file name is shadowstates.jpg

It’s impossible to take the current standard measure of shelter and backtest it. Who do and how do we conduct a survey, such as the following,

If someone was going to rent your home in 1977, how much do you think you would have rented it for, monthly, unfurnished, and without utilities?

Welcome to the 1970s, folks.

Here’s to hoping the big hair, perms, and disco do not return with inflation.

Monetary Policy

It looks like the Fed is going to slow-walk the tightening of monetary policy and set to repeat the mistake of the 1970s.  Lord, help us when inflation hits 20 percent.

The intellectual consensus among policymakers at the time was that cost-push inflation (the type of inflation arising from an increase in the prices of inputs to the economy, i.e., worker wages) was outside the influence of monetary policy (Romer and Romer 2012). In the words of an economist who presented to the Federal Open Market Committee in May of 1971, “the question is whether monetary policy could or should do anything to combat a persisting residual rate of inflation … The answer, I think, is negative. … It seems to me that we should regard continuing cost increases as a structural problem not amenable to macro-economic measures” (Romer and Romer 2012). – Federal Reserve History

Appendix

In general, two methods are commonly considered for incorporating the owner-occupied housing cost in inflation indices: the “net acquisition” and “rental equivalence” approaches.

The rental equivalence approach measures the evolution of the rents which owners would have to pay if they rented their accommodation. This means it is not based on actual prices or actual monetary transactions but imputed ones.

The net acquisition approach measures the price paid by households for new accommodation from outside the household sector. It is thus based on actual monetary transactions, but excludes transactions between households, which on net have no influence on the income available to the household sector. The net acquisition approach thus treats houses like other durable goods. — European Parliament 


Posted in Uncategorized | 6 Comments

Quote of the Day: Soros on Putin & Xi

#CKStrong

As a child, I had many encounters with Russian soldiers when they occupied Hungary in 1945. I learned that they would share their last piece of bread with you if you appealed to them. Later, at the beginning of the 1980s, I embarked on what I call my political philanthropy.

Meanwhile, Xi seems to have realized that Putin has gone rogue. On March 8, one day after Chinese Foreign Minister Wang Yi had insisted that the friendship between China and Russia remained “rock solid,” Xi called French President Emmanuel Macron and German Chancellor Olaf Scholz to say that he supported their peacemaking efforts. He wanted maximum restraint in the war in order to avert a humanitarian crisis.

It is far from certain that Putin will accede to Xi’s wishes. We can only hope that Putin and Xi will be removed from power before they can destroy our civilization. – George Soros, March 11th


Left: Russian President Vladimir Putin (R) shakes hands with his Chinese counterpart Xi Jinping after awarding him with the Order of St. Andrew the Apostle the First-Called during a meeting at the Kremlin in Moscow, Russia July 4, 2017. REUTERS/Sergei Ilnitsky/Pool | Right: Chinese President Xi Jinping (R) congratulates Russian President Vladimir Putin after presenting him with the Friendship Medal in the Great Hall of the People in Beijing, China June 8, 2018. Greg Baker/Pool/via REUTERS

Source: Atlantic Council

Posted in Uncategorized | 4 Comments

Chart of the Day: Russian Crude Oil Imports

#CKStrong

Source: Financial Times

Posted in Uncategorized | Leave a comment

How Much Gas Will the Average Hourly Wage Purchase?

#CKStrong

This chart illustrates how many gallons of gas – the national average of all grades and formulations – the average hourly earnings of production and nonsupervisory employees can purchase. We believe it’s imperative to give context to and normalize data.

Gallons per Average Hourly Earnings (AHE)

Our estimate for March is that the average wage of production and nonsupervisory workers, as measured by the BLS’ Average Hourly Earnings (AHE), can purchase 6.4 gallons, which is up from the low of 4.4 gallons in July 2008, and significantly lower than the high of 13.8 gallons in February 1999.  

Political Blowback

Think of the political implications of these data. 

In the 1998 midterms, for example, the Democrats accomplished a relatively rare feat of gaining House seats while they held the White House, even during President Clinton’s impeachment.

The high gas price relative to wages in July 2008 during #43’s presidency presaged the sound defeat of the Republican Pary in the 2008 general election. 

Not saying gas prices are the only factor that determine election outcomes, but it is a factor.  Moreover, the gas price appears to have an outsized impact on consumer psychology. 

Everything Bubbles

We forgot what an “everything bubble” the economy was before the Great Financial Crisis (GFC). However, the current “everything bubble” is more steely, driven by central bank base money rather than leverage in the housing market. All-cash purchases have replaced the mid-aughts wild and crazy exotic subprime mortgages.  

Moreover, the amount of private equity and investor money pouring into the housing sector has, among other factors, created a shortage of single-family homes,

Might the fact that corporate investors snapped up 15 percent of U.S. homes for sale in the first quarter of this year have something to do with it? The Wall Street Journal reported in April that an investment firm won a bidding war to purchase an entire neighborhood worth of single-family homes in Conroe, Texas—part of a cycle of stories drumming up panic over Wall Street’s increasing stake in residential real estate. Then came the backlash, as cool-headed analysts reassured us that big investors like BlackRock remain insignificant players in the housing market compared with regular old American families. – Slate

We conclude then and have been consistent in our belief that this “everything bubble” will end not with the popping of a credit bubble, such as the GFC, causing a  deflationary impulse.  But, a crisis brought on by inflation — it may be a political crisis or the major central banks panicking and overshooting in their efforts to normalize monetary policy as they lose control of inflation.  It may be a Black Swan. 

Nobody knows with any decent level of certainty. 

Stay tuned.

Posted in Uncategorized | 17 Comments

CPI Food Inflation: Carnivores In Pain

#CKStrong

Here’s the raw data from this morning’s CPI release. Make your inferences.

The percentage change in the Consumer Price Index for all items was up 0.8
percent in February and 7.9 percent y/y. All food items were up 1.0 percent in
February and 7.9 percent y/y. Energy prices were up 3.5 percent in February and
25.6 percent y/y. Therefore, for all items less food and energy, the core CPI
increased 0.5 percent in February and 6.4 percent y/y.

Higher food prices are negatively correlated with political stability.

Posted in Inflation/Deflation | 1 Comment

QOTD: The Putin Era Is Over

#CKStrong

QOTD:  Quote of the Day

So, to the people who were in power today who are making those national security calls, I don’t care if you’re a Republican or a Democrat or an Independent or anything else, we should wish them the best. Because they have got a challenge the magnitude of which we have not seen since World War II.

…I think he’s done. The Putin era is over. The only thing we need to now understand is the level of damage he’s going to do as he goes. And I think that could be substantial.Jon Huntsman

Jon Huntsman served as governor of Utah (2005–09) and as U.S. ambassador to China (2009–11) and to Russia  (2017–19). He ran for the Republican presidential nomination in 2012. 

Posted in Uncategorized | 4 Comments