
Our chart of the day (COTD) comes to from the Visual Capitalist.
First, some context from their website,
The Chart of the Week is a weekly Visual Capitalist feature on Fridays.
Ever since the invention of the internal combustion engine, oil has been one of the most crucial commodities on Earth. Without it, modern transportation as we know it would not be possible. Industries such as aviation, aerospace, automobiles, shipping, and the military would look nothing like they do today.
Of course, as we now know, this has all come with some extreme drawbacks from an environmental perspective. And while new green technology and the lithium revolution will aid in eventually reducing the role of oil in transportation, the fact is we still use 94 million barrels per day of crude worldwide.
As a result, the energy industry continues to have huge amounts of influence on our lives. Special interest groups with a focus on energy have influence on a domestic level. Meanwhile, from a foreign policy angle, countries like Saudi Arabia and Russia wield additional geopolitical and economic power because of their natural resources. It’s even arguable that everything from the Gulf War to the more recent Middle East interventions in Libya, Syria, and Iraq have been at least partially to do with oil.
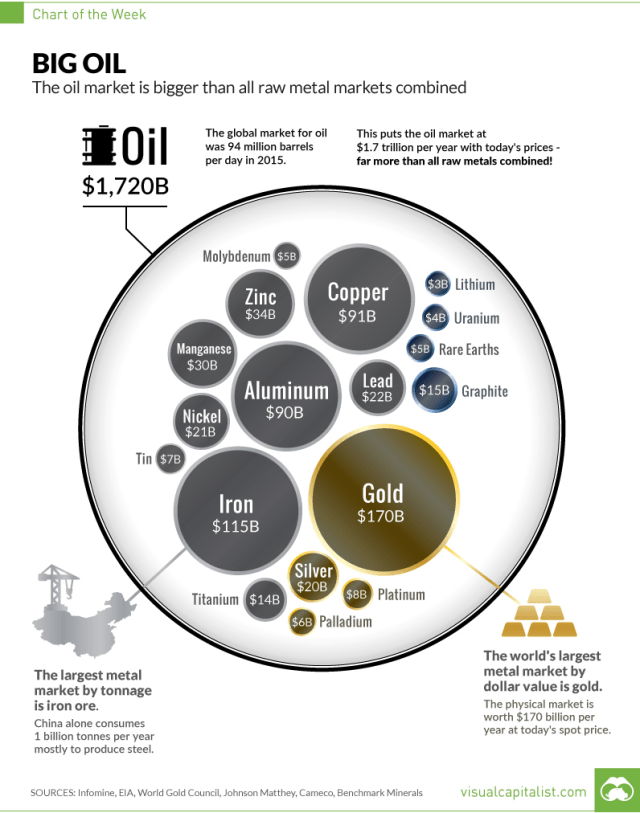
This week’s chart of the week aims to help explain the influence that oil has on countries and markets by using a very simple perspective: the size of the oil market vs. all metal markets combined.
The True Size of the Oil Market
While the amount of uses in one barrel of oil is quite incredible, we still need a mind-boggling amount of the natural resource each year to sustain consumption.
Oil production per year: 34 billion barrels (incl. other liquids)
Oil market size at current prices: $1.7 trillion per yearTo consider how big this actually is, we compare the annual market sizes of all major metals and minerals that are mined throughout the world:
- Gold: $170 billion
- Iron: $115 billion
- Copper: $91 billion
- Aluminum: $90 billion
- Zinc: $34 billion
- Manganese: $30 billion
- Nickel: $21 billion
- Silver: $20 billion
- Other metals: $67 billion (Including platinum, palladium, titanium, tin, moly, uranium, and more)
The total amount works out to $660 billion – just a tiny fraction of the size of the oil market.
Hat Tip, The Polish Oil Trader, Doug Skrypek

