We’re still tracking the Reagan-Trump S&P500 analog. We’ve noted it’s a fun exercise and probably useless in predicting the future move in the index given the different macroeconomic initial conditions at the beginning of both Administrations. But, hold on! It is getting interesting here.
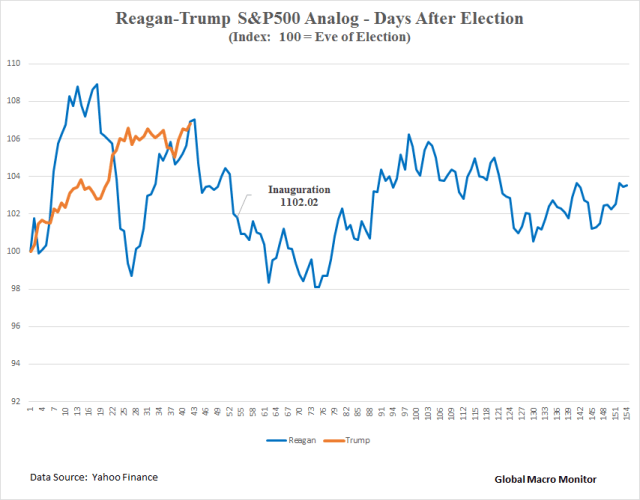
The chart below shows the Reagan S&P and the Trump S&P are trading right on top of each other after 42 days from the respective POTUS elections. In fact, the Trump S&P now trails Reagan by only .09 percent. If past is prologue, the S&P500 makes a new high on Monday and then succumbs to profit taking.
The Reagan S&P peaked on November 28, 1980, 18 days after the election, and entered a nasty bear market, which took the index down over 27 percent in 429 trading days, before the bull market began on August 11, 1982. The bull market was ignited by a precipitous drop in bond yields and U.S. economy exiting a very deep recession.
The macroeconomic conditions could not be more different as President Trump takes office.