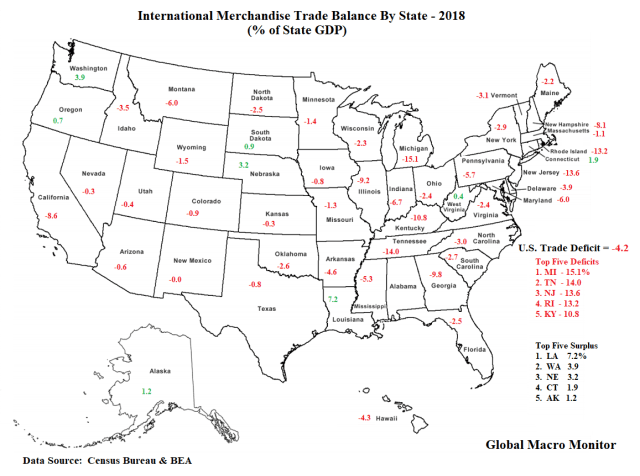
Our last post, Trade As Percent Of State GDP (2018), which illustrated the openness of each state to international trade normalized by the state’s GDP, provoked our curiosity about which states run the largest trade deficits with the rest of the world.
Of course, California, which is, by far, the country’s largest economy with a state GDP of over $3 trillion (14.5 percent of U.S. GDP with Texas a distant second at 8.7 percent ), ran a $260 trade deficit in 2018, or about 30 percent of the $879 billion trade deficit. Given the size of California’s economy, the trade balance-to-state GDP came in at -8.6 percent, however.
Data Caveats
There are a ton of caveats with the data but it does give a sense of the zip codes where states live when it comes to contributing to the overall U.S. trade deficit.
Trade data is not calculated on a value-added basis as is the GDP data. For example, we suspect much of Michigan’s imports consist of auto parts and used to produce exports in the automobile industry.
Moreover, a couple of years ago we posted the list of foreign suppliers in the Boeing 787 Dreamliner, which is manufactured/assembled in South Carolina.
Assembly is just a small part of the Dreamliner’s manufacturing value chain. The International Monetary Fund (IMF) noted in a recent working paper,
More than 70 percent of the plane’s value is not generated by Boeing. – IMF.The Post and Courier wrote yesterday the jetliner is…”comprised of more than 2.3 million parts made around the world.” — GMM, Feb 2017
Thus many of South Carolina’s imports go into assembling the Boeing 787 and then exported though only the valued-added of assembly is calculated in state GDP. Consequently, some countries have nonsensical export-to-GDP ratios which exceed 100 percent.
U.S.-China Trade Balance
The problem with how exports and imports are calculated also distorts the U.S. trade deficit with China. For example, the iPhone, which is assembled in China and only account for a small fraction of its value added, are counted at their final value in U.S. imports. See here.

Nonetheless, the data, though imperfect, are very interesting and enlightening.