
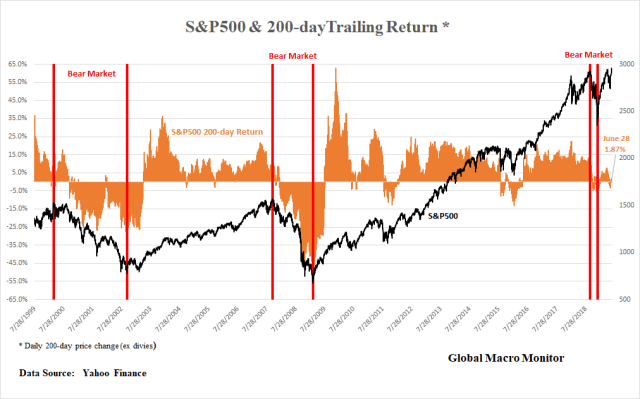
The S&P 200-day rolling return is an interesting chart but not much in the way of signals with the exception to illustrate the S&P500 does not fall out of the sky and enter bear markets after a strong 200-day run.
Bear Markets
Bear markets usually begin with a topping process, after all, markets are cold-blooded beasts and adapt and rationalize their bullish biases to negative news and deteriorating conditions. Until they don’t.
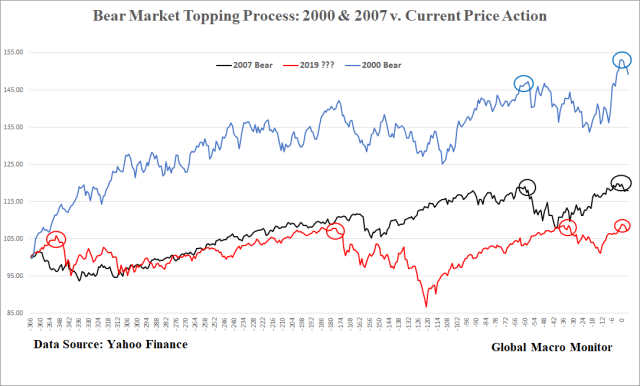
Inertia is innate in the stock market, in part due to Wall Street’s and the buy side myopic focus on the year-end bonus, but if equities can’t break out after making several local tops (see the second chart), caveat emptor and be warned something is rotten in the state of Denmark.
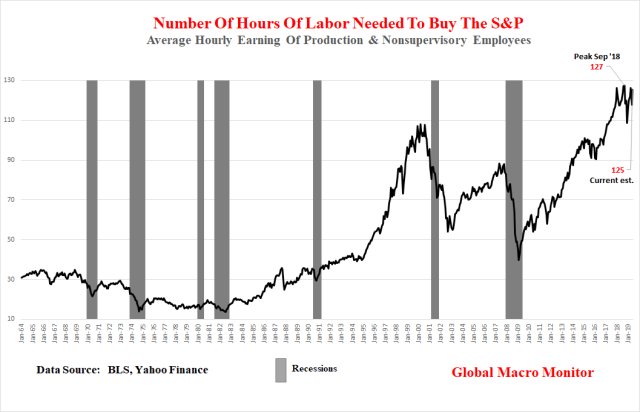
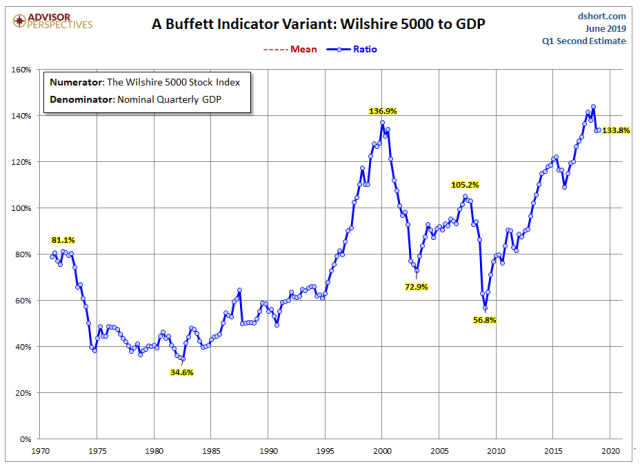
We remain medium-term bearish on U.S. stocks based mainly on macro valuations as the charts below illustrate there is not much room for stocks to run from here. Unless “this time is different” and trees stocks don’t do grow to the sky.
Surely, the S&P500 will rally tomorrow on the announcement of the restart of China trade talks. Is it sustainable?
Will the Trump concession on Huawei to get the Chinese back to the table, which is very bullish for the company’s American suppliers, soon be offset with concerns the Fed may now rescind some of its dovishness?
In our June 26th post, we stated,
Our best guess, however, is given President Trump’s low approval ratings moving into an election year, he is highly motivated to kraft some sort of truce or Potemkin China trade, which will be sold as the “greatest deal ever,” to give the market one last boost.
An S&P top of around 3025-3060 would repeat the topping zip codes of past history. — GMM, June 26th
Key Levels
Given the topping behavior of the 2000 and 2007 bears (the Sep’18 bear market was short and barely cleared the bar, down 20.2 percent peak to trough), an S&P top in the range of 3000-3100 would be consistent with recent history and the nominal highs made in 2000 and 2007. These levels are in the range of around 1-5 percent above the May 1st and June 21st high.
Until the S&P clears 3115, we will maintain our medium-term view that investors should be reducing risk by selling into strength. If the index does clear the key level, it will be time to suspend disbelief and move to the Venezuelan model of stock valuation.
A bear market could also ensue with time. Stocks could churn and burn around these levels for years. As of Friday’s close, the S&P500 is only 2.4 percent above its January 2018 local peak.
In the short-term, we have relatively high conviction traders will remain lathered up on the prospects — emphasis on prospects —of a China trade deal and Fed easing. We don’t and won’t fight that. No strategic shorts put out until the mid-3000 level unless the markets show clear signs of breaking.
Scalping the market with short-term buying and selling is a different story. That’s getting harder and harder with the rise of Auto & Algos (AA), however.
In the long-run, we shorts are all dead.
As always, we reserve the right to be wrong.
Topping Process
Initial Tops & Pops

Stocks Expensive Based On Macro Metrics And History


Hello, this weekend is nice designed for me, for the reason that this time i am
reading this fantastic informative post here at my house.