

I once heard the late, great financial economist Stephen Ross speak at a Lehman Brothers bond conference in Sun Valley, Idaho. He opened his presentation with a short story about how investors would approach him and ask, “if you’re so smart, why aren’t you rich?” He said his reply was always, “if you’re so rich, why aren’t you smart?” Touché!
The same Socratic logic can be applied to the permabulls, who have the probabilities on their side. The U.S. stock market likes to go up.
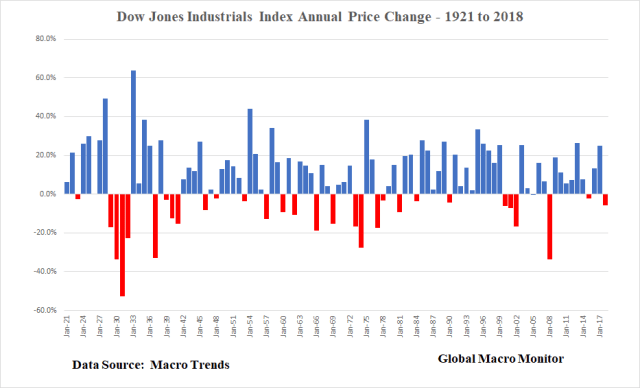
For example, the Dow has generated positive returns 68 percent of the years since 1921, and the S&P more than 72 percent since 1951.
Moreover, it doesn’t take much intellectual gravitas to proclaim stocks are in a “structural bull market.” Take a look at any long-term chart, as in more than 40 years, to see that any major stock index has moved from the lower left to upper right. The stock market, by definition, is a perpetual structural bull market. Innovation, growth and inflation have always, over the long-term, trumped fear.
Who in their right mind would consistently bet against a permabull, even if their message never changes — “the stock market will be up this year” — if the empirical probability of being correct is 70 percent? Someone headed for bankruptcy, that’s who. Permabulls for the long run!
Shorter Time Horizons
The above argument weakens significantly in shorter timeframes as the binary stock market return converges toward a random bet on a daily basis. The S&P Significant Digits table below illustrates this as the index generates positive daily returns only 53 percent of the time, 57 percent weekly, 60 percent monthly, and 66 percent on a quarterly basis.
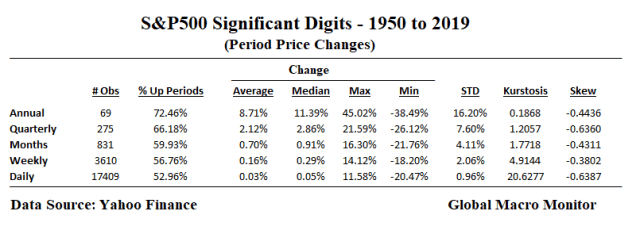
The data also show return distributions have more of a negative skew and a higher kurtosis — fatter or longer tails — the shorter the timeframe. That is one major factor why short-term traders have a higher risk of ruin than long-term investors.
Stock Market Annual Streaks
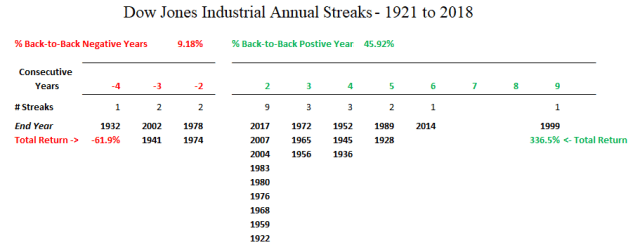
We were extremely surprised by the results of how rare back-to-back down years is for the Dow Jones Industrials. Only nine times since 1921 has the Dow had a down year after suffering a negative return the prior year, which includes two 3-year and one 4-year steak. The worst of which was the four consecutive down years at the start of the Depression, where the Hoover administration experienced a negative stock market every year in office, as the Dow lost 62 percent of its value.
Keeping with our theme, “the stock market likes socialism,” or government (or the Fed) bailout/interventions, the best year in the Dow was in 1933 after FDR took power and began to implement the New Deal. The 36 percent 3-year moving average of annual returns in 1936 topped the second highest level of 1997 by almost 1000 bps.
Of the 98 years of Dow returns we looked at since 1921, 46 percent generated back-to-back positive years, with the longest streak, the 9-year bull market ending in 1999, which lifted the Dow by 337 percent. The streak ended with the bursting of the dot.com bubble in Q1 2000, which then resulted in three straight down years in the Dow.
Thus, given the above data, after a down year, such as 2018, there is about a 90 percent empirical probability the Dow will generate a positive return in the next year, which implies annual returns are not independent. Rather stunning odds, nonetheless.
Upshot
So what about 2019?
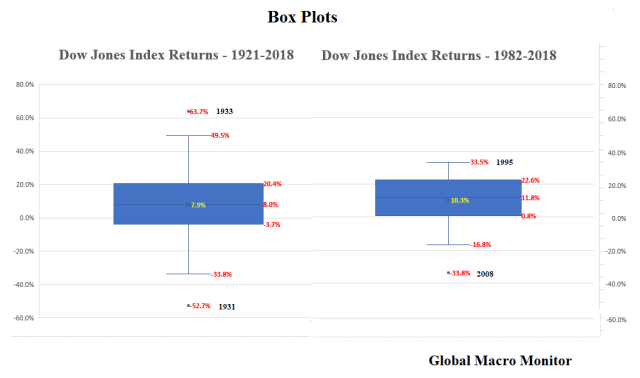
We don’t know and can’t say with any certainty, but given how rare it is for back-to-back down years, the higher probability bet would be for a Dow higher than where it started the year. Moreover, the average return for bounce years suggests the Dow, up 9.4 percent year-to-date, has around another 10 percent to go.
The big caveat, and the uncharted water Mr. Market currently finds itself is the shape of the yield curve. Though there are four trading days left in the month, 2019 could be the first bounce year since 1960 (our start year) where the yield curve is negative at the end of March.

Conclusion
Considering and internalizing the above data, it would then behoove investors to always keep timeframes long-term. The financial media, including this blog, is rendered mostly noise and, at best, entertainment for long-term investors.
There are a few times in history, however, – we count five – where reducing risk was a smart move, which allowed investors to reinvest at a significantly lower price without the risk of being left behind in a V bottom bounce. Those times to sell were in the 1910s, 1929, late 1960s, Q1 2000, and 2007, most of which were known at the time to be a period of historically high and extended valuations but justified by the mass and social media as a “this time is different” situation.
We are not even sure most even see what we perceive or they choose to ignore it, surrendering to the all the rage passive investing, which, ironically, is based on the very analysis in this post.
Given the current combination of historically high market valuations, the high levels of sovereign and corporate debt, record-high budget deficits, the shifting geopolitical tectonic plates, the end of the post-War era and Pax Americana, and the extreme wealth and income disparities, we sense today is one of those times. That is why we are and will continue to take money off the table in this rally, which we suspect will be the blow off before another historic Big Dipper, that is a 40 plus percent bear market.
The global monetary authorities will then likely kick into full monetization mode with new regimes, such as a “People’s QE”, which directly finance consumption and other schemes to finance infrastructure investment, for example. Our brothers and sisters in the MMT crowd will finally have their day and the people will suffer the consequential inflation and stagflation as confidence in the currency plummets, and money demand collapses. This may take some time to play out but we are fairly confident, play out it will.
The deflatiionistas will, for sure, win the next few battles but, we are almost certain, will lose the war.
We are also cognizant our scenario contradicts the historical data and, as always, we reserve the right to be wrong. Like us, investors should always have a Plan B, whatever their strategy, in the event they are wrong.
Stay tuned.


Pingback: Quarter In Review – March 28 | Global Macro Monitor
Pingback: Is “Obama Envy” Driving Trump’s Call For QE4? | Global Macro Monitor
Pingback: Key S&P Levels | Global Macro Monitor
Pingback: Jobs Market Weaker/Risks Higher Than Perceived | Global Macro Monitor
Pingback: Are Stocks In A Bear Market? | Global Macro Monitor
Pingback: Are Stocks In A Bear Market? | Real Patriot News
Pingback: Are Stocks In A Bear Market? | StockTalk Journal
Pingback: Charts That Validate Stocks Are In The Process Of Topping | Global Macro Monitor
Pingback: Chasing The FOMO Titanic Rally | Global Macro Monitor
Pingback: Why So Few Bears Own Park Avenue Apartments | Global Macro Monitor
Pingback: Why So Few Bears Own Park Avenue Apartments – Maris Research
Pingback: Why So Few Bears Own Park Avenue Apartments
Pingback: Why So Few Bears Own Park Avenue Apartments – Right Wing Economics
Pingback: Why So Few Bears Own Park Avenue Apartments | Real Patriot News
Pingback: Global Risk Monitor: Weekly Update – May 2 | Global Macro Monitor