
It’s the economy dollar, stupid. And its impact on manufacturing payroll jobs.
Trump’s Economic Scorecard
Trump’s economic comps versus the prior 29-month period before taking office just aren’t that impressive even as he touts “it’s the greatest economy ever.” Tomorrow we get the first look at the Q2 GDP print. The Atlanta Fed’s is forecasting a compounded annualized increase of 1.3 percent, down from 3.1 percent in Q1.
Jobs
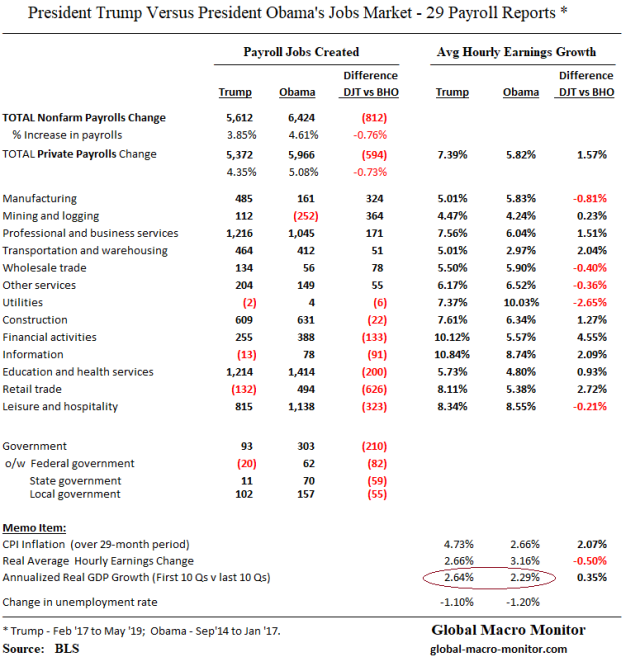
The data above illustrate employment created under President Trump lags significantly the prior 29-month period, by almost one million payroll jobs, or -812k, including private payrolls of -594k. Nominal wages are higher but the purchasing power is negated as inflation has almost doubled.
Yes, we get it the supply of workers is shrinking.
Mining and Manufacturing Payrolls: Oil Prices & Dollar Correlation
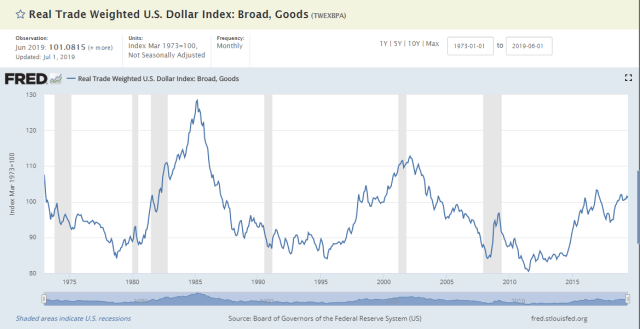
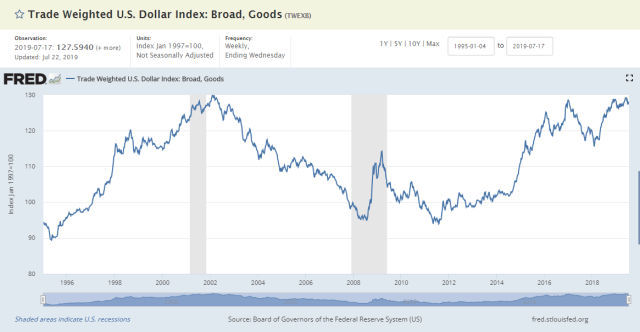
Where the job comps (emphasis on comps) favor the Trump administration most are in mining and manufacturing, which can, in large part, be explained by 1) the recovery in oil prices in the case of mining, where the majority of the recovery took place in support activities for oil and gas operations, after the 75 percent crash in WTI from July 2014 to February 2016, and 2) the 20 plus percent strengthening of the dollar in the 29 months leading up to the birth of the Trump administration, which torched the manufacturing sector, particularly in metals and machinery.
We go deeper on manufacturing payrolls and the dollar in this post and leave mining and oil prices for later.
Durable Manufacturing

The table shows that durable manufacturing payrolls under Trump have outpaced the prior 29 months by 367k jobs, primarily the result of the recovery of job losses that took place in the metals and machinery sectors, which, we believe were adversely affected by the spiking dollar. Contrary to popular wisdom, the payroll increase in auto manufacturing is lower under President Trump than the prior period.
Dollar Correlation
Take a look at these correlations between the 3-month moving average of monthly manufacturing payroll changes and the year-on-year change in the trade-weighted dollar with various lags. We wrote in an earlier post it makes sense to look at lags,
Theoretically, it also makes sense as manufacturers do not change their hiring decisions based on short-term moves in demand, relative price changes, or competitiveness. A sustained move in the dollar for, say, over a one year period may incentivize management to change production and hiring decisions, which then takes months to ramp up. – GMM, July 8th

Those are stunning correlations, folks, which measure how jobs and the dollar move together. A perfect correlation would be -1.0 or 1.0.
A negative correlation between the change in manufacturing jobs and dollar moves makes perfect economic sense and explains why Trump wants a weaker dollar, which creates a more competitive manufacturing sector ergo more jobs in the rust belt.
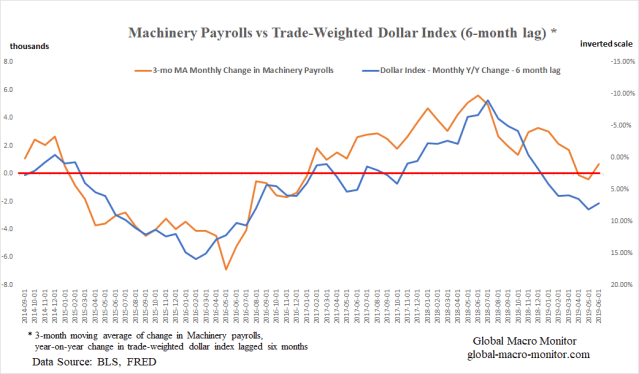
We can’t stop staring at the above chart, which illustrates the -0.88 correlation between the 3-month moving average of the monthly change in the machinery sector payrolls and the year-on-year monthly change in the trade-weighted dollar index, lagged six months.
Politics
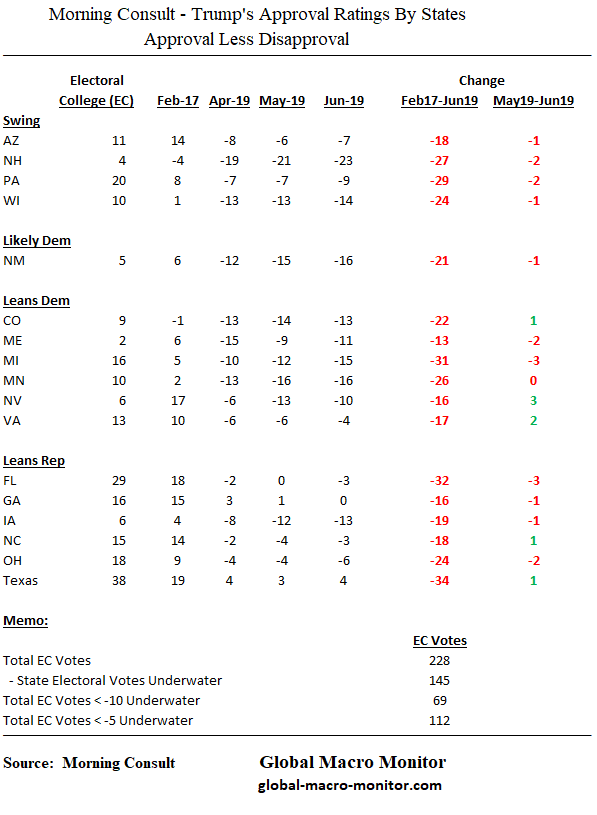
The following table is the latest tracking poll data from Morning Consult on the President’s approval ratings in the states that matter most in 2020. He is now underwater in every state but Texas and even in Georgia.
Now, do you understand why Trump takes an ugly stick to Chairman Powell on an almost daily basis?
The Trump administration’s economic and political advisers may not have formally run the correlations and connected the dots but they are sure acting as if they have.
Prepare for a currency war.
Appendix


Pingback: The Secular Decline in U.S. Manufacturing Employment | Global Macro Monitor