
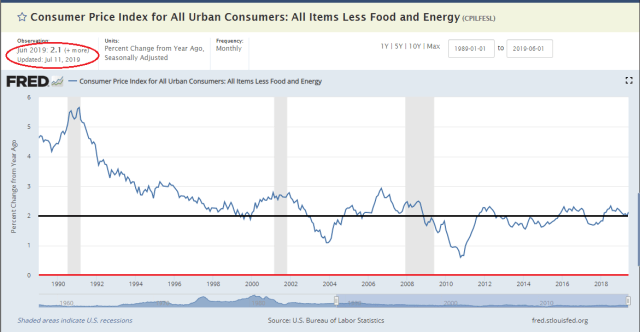
Core CPI consistently prints around 2 percent, the average over the past eight years, with the latest reading of the June core rate coming in at 2.1 percent. Sure, we can find another index to show lower or higher rates of inflation. Your choice for your confirmation bias.
We maintain the Fed has achieved their targets of 2 percent inflation and full employment. Many on Wall Street and in the White House do not believe the Fed has hit the Dow and S&P500 targets, however, thus we will get a rate cut next week.
Go ahead, call us cynical.
Housing And Shelter In Basket
We’re not big fans on how the government measures inflation, in the first place, as the largest portion of any consumer basket is housing (42 percent in CPI basket), which includes shelter (33 percent), and just doesn’t pass the smell test in terms of a true metric of price changes or even a cost of living measurement.
Because the majority of families own their homes, the government uses a proxy called owners equivalent rent (OER) to measure housing inflation, which is 24 percent of the CPI basket. The BLS changed how housing was measured in the CPI basket after the big inflation of the late 1970s, in an attempt to separate housing as an investment versus the shelter services it provides.
We haven’t formally tracked it but our priors are OER doesn’t come close to the changes in the monthly mortgage payments of average urban consumers. Furthermore, the BLS makes hedonic adjustments to rents (7 percent of the basket).
With each passing year, the dwellings in the CPI housing sample deteriorate, losing some value (depreciate), and deliver less shelter service to their occupants. If this were not taken into account, the CPI would have a downward bias. To offset this quality loss, the aging bias due to depreciation, staff at BLS developed an age-bias adjustment. This tool, which BLS began using with the CPI for January 1988, makes a monthly incremental adjustment to each housing unit in the sample to maintain a constant quality index over time.
The theoretical basis for the hedonic method used in estimating age bias is found in Randolph (1988). Randolph estimated that the age bias due
to depreciation was 0.3 to 0.4 percent annually. — BLS
Whether it’s an upward or downward adjustment, the fact is none of the shelter prices are real prices paid, which seems absurd to us.
Younger Generations Priced Out Of Housing
Moreover, the reflation of the housing bubble coupled with the rapid increase in student debt has priced much of the younger generation out of the housing market.
For generations, the wealth of U.S. households was built on the foundation of homeownership. That is changing.
Homeownership rates for younger Americans have fallen sharply over the last decade. The median age of a home buyer is 46, the oldest since the National Association of Realtors began keeping records in 1981. Economists, policy makers and mortgage lenders expect the trend to extend to younger generations. The decline illustrates what for many Americans is the real legacy of the financial crisis. – WSJ
That 7 percent weight for rents in the CPI basket is going to have to be increased. See here how weights in the basket have changed over the years.
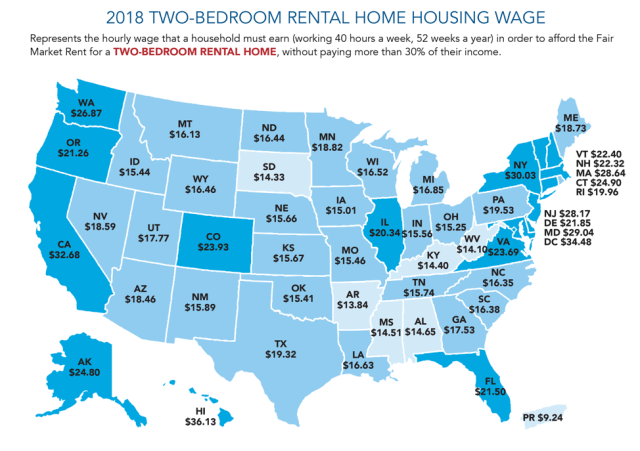
$70k Annual Salary Required To Afford 2-BR Apartment In California
Take a look at the map below and then ask yourself, “are the official inflation statistics capturing the real cost of living and price changes?” We believe the answer is so freaking obvious.
For most Americans, access to decent, affordable rental housing remains cruelly beyond reach. Only in 22 counties in the United States is a one-bedroom home affordable to someone working 40 hours per weekat federal minimum wage. — CityLab
See here why some argue that the CPI actually “overstates” inflation and why the Fed’s preferred measure of inflation is the PCE deflator. We disagree, as we are more interested in measuring true inflation not a hypothetical cost of living index, but provide the argument and let you decide.
inflation – a persistent, substantial rise in the general level of prices related to the volume of money and resulting in the loss of value of currency – dictionary.com


Another great analysis, Gary.
>
Pingback: Fed To Cut With “Loose As A Goose” Financial Conditions | Global Macro Monitor
Pingback: Our Favorite Chart: Core CPI | Global Macro Monitor
Pingback: Is the Fed lowering rates with official inflation increasing? - NAMELY LIBERTY