The Difference Between a Spinning Top and a Doji
Spinning tops and dojis both represent indecision. Dojis are smaller, with small real bodies and small upper and lower shadows. The Spinning top has long upper and lower shadows. Both patterns occur frequently and are sometimes used to warn of a reversal after a strong price move. Both types of candlesticks rely heavily on confirmation. A strong move after the spinning top or doji tells more about the new potential price direction than the spinning top or doji itself. – Investopedia

Can’t believe we’ve been sucked into the daily market noise but the recent price action seems kind of important as to whether stocks either break or breakout here. See our last two posts here and here.
We are far from the old Japanese rice traders who mastered the art of price candlesticks but do use the candles to give us a sense as to where the market’s at, and to cut through the fog and random noise of daily price movements.
Up On Brexit
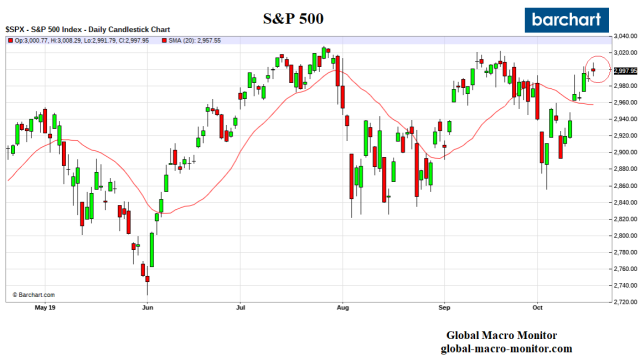
The S&P traced out a spinning top today, where much of the move took place before the open when BoJo and the EU announced a Brexit deal. Now the PM needs to get Parliament to ratify it, which is far from certain. BoJo needs 320 votes and PredictIt is giving that only a 36 percent probability of happening by the October 31 deadline.
The S&P closed higher than Tuesday’s close, which is positive but it couldn’t hold its gains and was rejected at around 3009, very close to the recent swing closing high.
Key Levels

There does seem to be a lot of confidence and self-interest in the Street that stocks are about to break higher. And it doesn’t appear there are many sellers and the market trades like speculators are short.
No Short Interest
However, we came across the following Bloomberg piece that dispelled that notion and reinforces our bearish bias. 
Bets against U.S. stocks haven’t been this low since last October — just before the deepest sell-off in a decade.
Short sales in the SPDR S&P 500 ETF Trust as a percentage of shares outstanding fell to just 2.6% this week, according to data from IHS Markit Ltd., signaling optimism that American equities can push back toward all-time highs. But the setup has some investors on edge.
“Is it another sign of complacency? Smells like it,” said Yousef Abbasi, global market strategist at INTL FCStone. “The market is being stubbornly optimistic in the face of several headwinds. It does feel dangerous.” — Bloomberg, Oct 17th
We are looking for confirmation and sell trigger with a break below 2958.
As always, we reserve the right to be wrong and often are.
Stay frosty, folks.


