
We’ve been ignoring the daily noise of the stock market given the futility of trying trade against the blatant market manipulation but especially, after the S&P met our target of 3025, which we posted on April 1st,
If you have been reading GMM, you know our thoughts on equities. The sheer momentum of such a strong first-quarter carries over into the rest of the year, which is the justification of our year-end S&P target of 3025. – GMM, April 1st
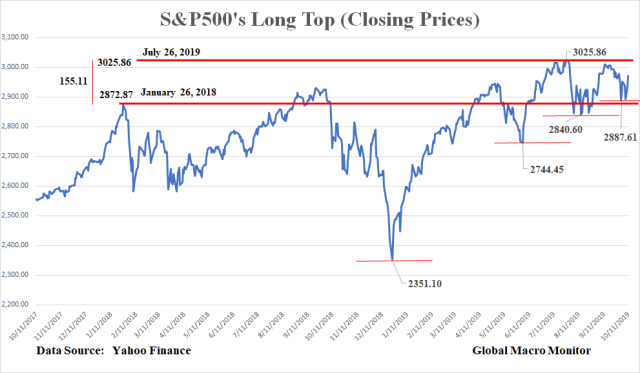
Check. The S&P peaked on July 26, closing at 3025.86.
Unlike most, however, we didn’t lift our target and began selling as we try not to let price action determine our fundamental view.
We have entered the selling zone — S&P 3025-3100 — to execute the Get Shorty trade. This also provides an excellent opportunity for long-term investors to start cutting back on risk if they have not already been doing so.
You know our view. Rarely should LT investors reduce risk in a significant manner, maybe just three to four times during their working lives, but this is one of those times, we believe. – GMM, July 26th
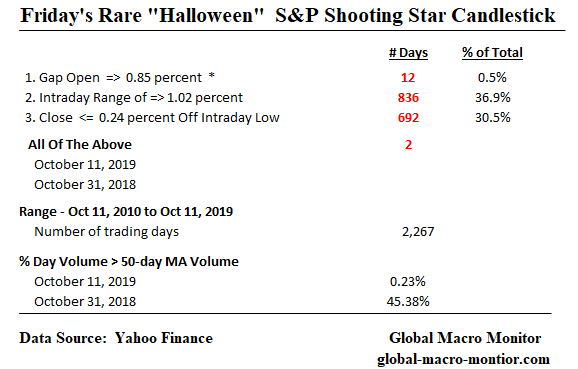
Friday’s Rare “Halloween” S&P500 Candlestick
We do sit up and listen, however, with the type of rare price action exhibited in the S&P500 on Friday.
The rare shooting star candlestick formation has only exhibited all three of the following price action characteristics (greater/less than or equivalent % changes) once since October 2010. On Halloween 2018. Spooky.
- The large gap-up open of 0.85 percent is very rare and has only occurred 12 times since October 2010, or 0.5 percent of the trading days, all during the Trump administration, by the way, clearly reflecting the power of POTUS’ tweets and market manipulation. Note, the cash S&P does not reflect the jankee-spanky, which takes place in overnight futures trading.
- Friday’s intraday trading range of 1.02 percent, though not rare, has occurred about 37 percent of the time since October 2019 and 11 of the past 16 trading days.
- Finally, the S&P closed 0.24 percent off its intraday low, which, again, is not that rare, occurring 30.5 percent of the trading days in the timeframe.
What is rare, however, is when all three of the above occur on the same trading day. Again, only twice since October 2010, on Friday and last Halloween.
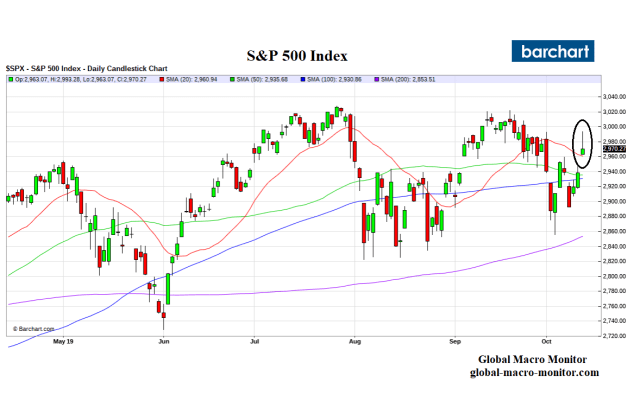
Shooting Star Candlestick – October 11, 2019
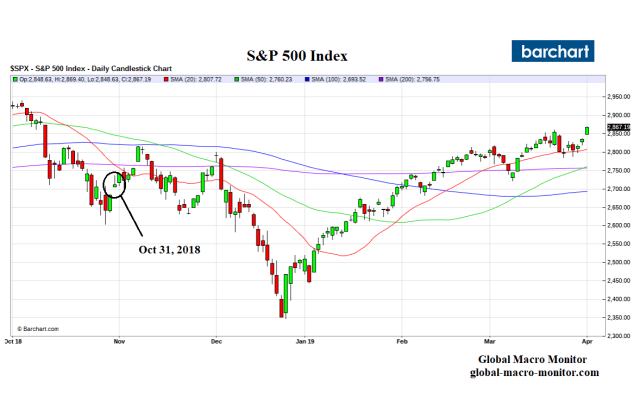
Shooting Star Candlestick – October 31, 2018 (Halloween)
Many other market indices experienced similar shooting star candlesticks on Friday. Go to the Slope of Hope website for an excellent review.

What Does A Shooting Star Candle Signal?
Investopedia does a good job of ‘splaining.
A shooting star is a bearish candlestick with a long upper shadow, little or no lower shadow, and a small real body near the low of the day. It appears after an uptrend. Said differently, a shooting star is a type of candlestick that forms when a security opens, advances significantly, but then closes the day near the open again.
For a candlestick to be considered a shooting star, the formation must appear during a price advance. Also, the distance between the highest price of the day and the opening price must be more than twice as large as the shooting star’s body. There should be little to no shadow below the real body. – Investopedia
The shooting star candle is not a perfect forecaster, nor is its signal of a pending price reversal always timely. It is a warning flag, however, and traders should take heed when they witness one.
Halloween 2018
Take a look at last Halloween’s S&P shooting star. The index consolidated the next few days then gapped up with a nice long green candle, which probably sucked in many traders into long positions. The next day the S&P formed a long-legged Doji before rolling over to eventually crash to the December 2018 low, forcing the market socialists to call, no scream for a Fed rescue.
Upshot
The key now is to watch the price action next week.
A break on Monday of 2960 (see below for key support levels) or the formation of more Doji candlesticks will further reduce the market fog and indicate the market is probably headed for some trouble.
TINA is not an attractive investment proposition for us and a dangerous gambit given the ubiquitous geopolitical and domestic political risk. Moreover, Friday’s price action was a giant meh to the hyped China trade deal, which was no deal at all and still leaves all the uncertainty in place for the business community.
Furthermore, if you think the market was pricing the new October 15 tariffs to take effect, which were taken off the table, I’ve got a new conspiracy to sell you.
S&P Key Levels
We do have conviction the top, or near-top is in for the S&P.
In fact, we believe the bear market began in January 2018 and the S&P in the midst of forming a very long top. Stock buybacks have restricted supply and there doesn’t seem to be as much leverage in the financial markets — x/ weaker credit corporates — as the liquidity created by endogenous money (deposits through credit expansion) that can vanish and contract during market panics has been, in large part replaced by QE.
We, therefore, suspect this bear market will be long and drawn death by a thousand cuts as it grinds and zig zags lower.
As always, we reserve the right to be wrong.
Stay tuned.
Short-term S&P Levels To Watch
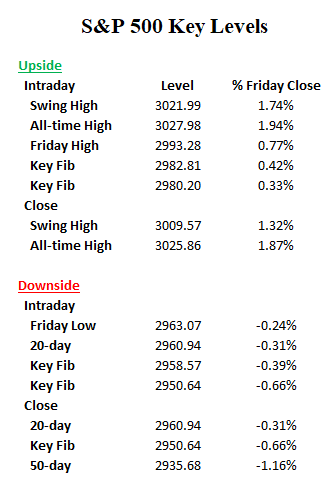
S&P500 – Support & Resistance Levels

The S&P’s Long-Top
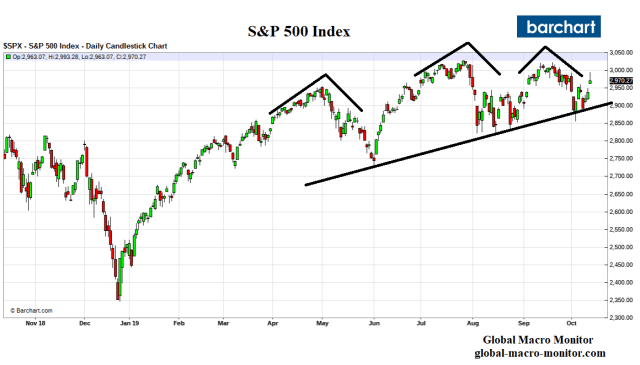
Rolling Head & Shoulders Chart Formation
Running Out Of Free Lunches
We are almost out of free lunches, folks, and will be posting only sporadically unless your support increases. Donate whatever you think is fair by clicking on the PayPal button just below the Twitter and search icons on the upper right-hand side of the blog. You do not need a PayPal account and can use almost any credit card.
Don’t be a free rider. Thanks, so much.


Pingback: Brexit Market Plummets – “The Clock Is Ticking” | Global Macro Monitor
Pingback: How Far Can The Stock Market Run? | Global Macro Monitor
Pingback: How Far Can The Stock Market Run? – SYFX+
Pingback: How Far Can The Stock Market Run? – iftttwall
Pingback: How Far Can The Stock Market Run? – TCNN: The Constitutional News Network
Pingback: ¿Hasta dónde puede correr el mercado de valores? | Black Swan Finances
Pingback: Beware Of The S&P’s Doji City | Global Macro Monitor
Pingback: S&P500 Traces Out A Spinning Top Daily Candlestick | Global Macro Monitor