
Updated: October 15
Very little to the upside. Very much to the downside.
Macro Valuation Metrics
Lots of incoming over our S&P Shooting Star post, most of which can mostly be summed up to the effect, “Why so bearish?”
Seriously? Our predisposition to the market is always anchored in time tested valuation metrics, which are hard to manipulate. That is why we like market capitalization deflated by some macro variables, such as nominal GDP or wages.
Micro measures, such as Price-to-Earnings are way too distorted by buybacks and can be easily manipulated by CFOs, who play around with variables such as depreciation or loss reserves.
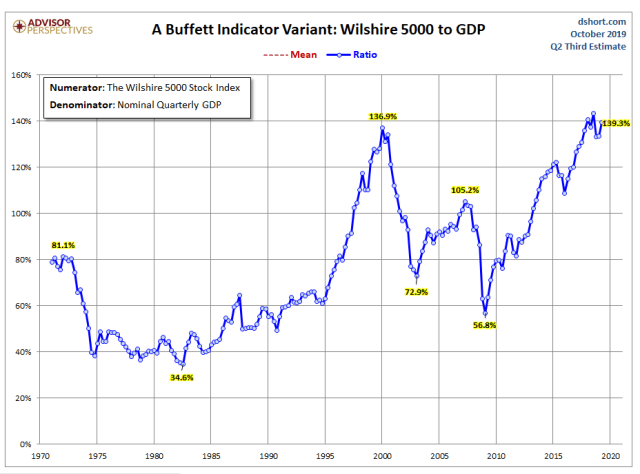
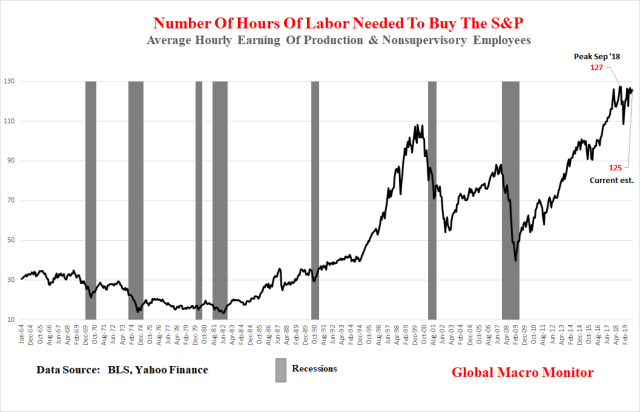
Our two favorite are 1) market cap-to-GDP, which, according to Warren Buffet is, “the best single measure of where valuations stand at any given moment.” Take a look at the following chart and you will understand why the Oracle of Omaha is sitting on a record $122 billion stockpile of cash, 2) the number of hours of work needed to buy the S&P500, not a perfect valuation measure but does track our other favorite quite well. The average person, making the average salary is not a big holder of stocks but the metric does give a heads up when the stock market becomes divorced from the underlying economic trend.
Take a look at the data and you decide, folks. Keep in mind, the charts are ratios, not price indices, and can’t continue to rise from lower left to upper right, forever.
Turn off the talking heads on bubble vision and #FinTwit, who will find it difficult to interpret the following charts because their salaries and year-end bonuses depend on their not understanding them or are incentivized to dismiss them outright.
 Source: Advisor Perspectives
Can markets, once again, convince themselves that historic valuations no longer matter? That this time is different?
Possibly, but they will need a prevailing narrative to fuel the delusion.
Quantitative Easing Forever
It could come in the form QE Forever, which we don’t think is very probable. That jig is almost up and any further rise in inflation will put a stake through its heart. The Cleveland Fed’s median CPI just pierced 3 percent for the first time since the Great Financial Crisis (GFC).
H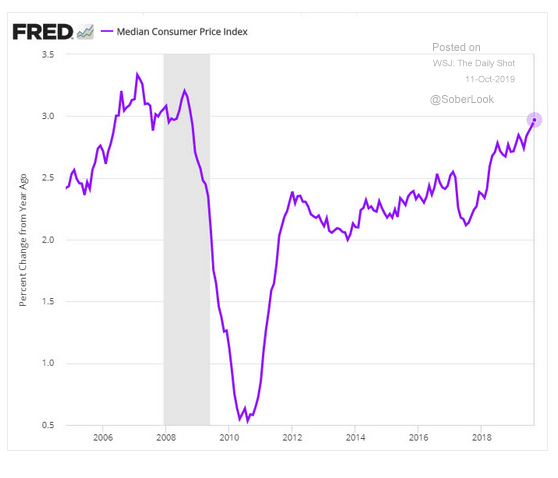
Source: The Daily Shot
AI
Artificial Intelligence? This is the one to watch, which will be a major disruptive force for decades to come.
The theme goes something like this: Companies can lay off all their workers and replace them with machines and algorithms, which will inflate margins to infinity and beyond.
The problem with this scenario is it would crush aggregate demand and economic growth. The geniuses are trying to find a balance and, thus far, have come up with concepts such as Universal Basic Income (UBI) and Modern Monetary Theory (MMT).
Stay tuned.
Wake us up after the above charts regress to their means, about 40 percent lower.
Running Out Of Free Lunches
We are almost out of free lunches, folks, and will be posting only sporadically unless your support increases. Donate whatever you think is fair by clicking on the PayPal button just below the Twitter and search icons on the upper right-hand side of the blog. You do not need a PayPal account and can use almost any credit card.
Don’t be a free rider. Thanks, so much.


Pingback: How Far Can The Stock Market Run? – Finanz.dk
Pingback: Até Que Ponto O Mercado De Ações Pode Funcionar? – Brasil No Caos
Pingback: How Far Can The Stock Market Run? – SYFX+
Pingback: How Far Can The Stock Market Run? | Newzsentinel
Pingback: How Far Can The Stock Market Run? – TCNN: The Constitutional News Network
Pingback: How Far Can The Stock Market Run? – TradingCheatSheet
God, you’re so insightful. Thank you so much for re-posting D-short graphs and asking to get paid for it! Awesome work brah!
Wow, JB. Worried about the year-end bone? No worries, your clients are on autopilot as you milk them.
Pingback: How Far Can The Stock Market Run? – ProTradingResearch
Pingback: How Far Can The Stock Market Run? | ValuBit
Pingback: How Far Can The Stock Market Run? | Zero Hedge
Pingback: In One Chart: One look at this and you’ll get why Warren Buffett sits on a record cash pile – Main Street Alerts
Pingback: In One Chart: One look at this and you’ll get why Warren Buffett is sitting on a record cash pile – investordummies
Pingback: In One Chart: One look at this and you’ll get why Warren Buffett is sitting on a record cash pile – Axe Report
Pingback: One look at this and you’ll get why Warren Buffett sits on a record cash pile – FINANCIAL CENTS
Pingback: In One Chart: One look at this and you’ll get why Warren Buffett sits on a record cash pile – Daily Buzz
Pingback: One look at this and you’ll get why Warren Buffett sits on a record cash pile – Finance Magazine
Pingback: In One Chart: One look at this and you’ll get why Warren Buffett sits on a record cash pile – Preferred Alert
Pingback: In One Chart: One look at this and you’ll get why Warren Buffett sits on a record cash pile – Buzzmark News
Pingback: In One Chart: One look at this and you'll get why Warren Buffett sits on a record cash pile | Download Bay Area
Pingback: In One Chart: One look at this and you’ll get why Warren Buffett sits on a record cash pile – Mega Stock Alert
Pingback: In One Chart: One look at this and you'll get why Warren Buffett sits on a record cash pile | Financial Feeds
Pingback: One look at this and you’ll get why Warren Buffett sits on a record cash pile - MarketWatch - eTrust News
Pingback: One look at this and you’ll get why Warren Buffett is sitting on a record cash pile – MarketWatch – Learn From the Best How to Day Trade the Financial Markets
Pingback: One look at this and you’ll get why Warren Buffett is sitting on a record cash pile - MarketWatch | Incentive Lure
Pingback: One look at this and you’ll get why Warren Buffett is sitting on a record cash pile – MarketWatch – GANATAMULYA NEWS
Pingback: Futures VIX Stock Market One look at this and you’ll get why Warren Buffett is sitting on a record cash pile – MarketWatch | Elite Investor
Pingback: One look at this and you’ll get why Warren Buffett is sitting on a record cash pile – MarketWatch – tyrannyorfreedom
Pingback: One look at this and you’ll get why Warren Buffett is sitting on a record cash pile – MarketWatch – Hot Showbiz Gossips
Pingback: Stockmarketdoc Oct. 16, 2019 – Educational Financial Newsletter
Pingback: Dow Futures Slide as ‘Buffett Indicator’ Hits Dot-Com Bubble Heights | My Videos
Pingback: Cryptocurrency News Dow Futures Rush as ‘Buffett Indicator’ Hits Dot-Com Bubble Heights - INFOSHRI
Pingback: Dow Futures Slide as ‘Buffett Indicator’ Hits Dot-Com Bubble Heights – btcTip.me
Pingback: Dow Futures Slide as ‘Buffett Indicator’ Hits Dot-Com Bubble Heights - Bahis Turkiye
Pingback: How Far Can The Stock Market Run? – Value investing
Pingback: Dow Futures Slide as ‘Buffett Indicator’ Hits Dot-Com Bubble Heights – XBIT
Simple but great analysis. The part I think that you may be off on is QE forever. How do we gauge the limits of how far it can run? Will the fed who follows the tweets of Trump really care about inflation until it becomes hyper? And even then chances are the mentality will just be, “it’s the next guys problem”.
Not sure, but inflation at, say 4 percent, the markets should begin to force their hand. Thanks for the comment, JW.
Yea perhaps. But when I run comparisons to M2. It makes me wonder, “perhaps this can go a lot longer and further than any of us think”.
Jeremy, You need to create a ratio from those two time-series. Most time-series charts look like that. It is important to look at deviations from both trends, which is now at historic levels for stocks and the economy. I would be interested to see Stock Cap/M2… Though M2 is an economic indicator almost as archaic as horseshoe prices.
If you think M2 is archaic then what do you use to measure for Fed printing?
Pingback: Dow Futures Slide as ‘Buffett Indicator’ Hits Dot-Com Bubble Heights – News NMN and Co
Really good stuff. Sadly I don’t use Pay Pal or give out my credit card.
Accessing my g Mail is sporadic but U can try. Send an address and i’ll Mail a donation.
No worries. Enjoy the ride!
Ol Don: It’s 2020 The Russians, Chinese and NoKo’s already have your cc numbers and your SSN and address, and pictures of your face, too. Charge a donation and if something weird shows up on your card dispute and cancel it.
Pingback: Dow Futures Slide as ‘Buffett Indicator’ Hits Dot-Com Bubble Heights | BLOCKHEADS
Pingback: Dow Futures Slide as ‘Buffett Indicator’ Hits Dot-Com Bubble Heights – Digital Coin Owner
Pingback: Most Overvalued Equity Markets – IMF | Global Macro Monitor
Pingback: Golden Crest Investment » Dow Futures Slide as ‘Buffett Indicator’ Hits Dot-Com Bubble Heights
Pingback: Dow Futures Slide as ‘Buffett Indicator’ Hits Dot-Com Bubble Heights – Eurosceptic News
Pingback: Dow Futures Slide as ‘Buffett Indicator’ Hits Dot-Com Bubble Heights | 코인하우-비트코인, 블록체인 기타 코인정보 큐레이터
Very good!
Thanks, Barry,
This is the first time I saw your article. I agree that there is no free-lunch but nothing gets to my credit card. I can send you a check if you give me an address but, as a small investor, what’s in it for me? I linked because I wanted to read Warren Buffett’s reasoning on holding cash.
No problem, Dr. Den. Enjoy the free ride. Go DucK!
U R screwed up with these charts…
The only reason WB sits on the sidelines is because of Dumbo Trumps policies & actions…
You may be right, I have no idea what motivates, WB. But look at the charts. Do you think the market can continue to outpace the economy? Even if stocks returned 5 percent for the next 20 years in an economy that grows at 3% with 2% inflation, the chart would still be at record highs.
Pingback: Dow Futures Slide as ‘Buffett Indicator’ Hits Dot-Com Bubble Heights – Fund via Crypto
Pingback: Dow Futures Slide as ‘Buffett Indicator’ Hits Dot-Com Bubble Heights – Cryptocurrency News and Breaking Crypto Updates
Pingback: Dow Futures Slide as ‘Buffett Indicator’ Hits Dot-Com Bubble Heights – Green Money
Pingback: Time To Start Discounting A Hard Left Turn | Global Macro Monitor
Pingback: Is It Time For The Market To Start Discounting A Hard Left Turn? – SYFX+
Pingback: Is It Time For The Market To Start Discounting A Hard Left Turn? – iftttwall
Pingback: Is It Time For The Market To Start Discounting A Hard Left Turn? | The Reclaimed Press
Pingback: Is It Time For The Market To Start Discounting A Hard Left Turn? | ValuBit
Pingback: Is It Time For The Market To Start Discounting A Hard Left Turn? | Real Patriot News
Pingback: Is It Time For The Market To Start Discounting A Hard Left Turn? – The Conservative Insider
Pingback: Enter The Selling Zone 2.0 | Global Macro Monitor
Pingback: Enter The Selling Zone 2.0 | Global Macro Monitor
Pingback: Enter The Selling Zone 2.0 – SYFX+
Pingback: Enter The Selling Zone 2.0 | Newzsentinel
Pingback: Enter The Selling Zone 2.0 | Zero Hedge
Pingback: A Long Way To The Bottom For Stocks | Global Macro Monitor
Pingback: Texas hold 'em - CW Industrial Partners
The use of valuation metrics like market cap-to-GDP is a compelling approach for understanding stock valuations.