We have warned about looking at averages (see here), especially with such skewed distributions and how a couple outliers can greatly distort this most common statistical metric.
Real Life Macro Economy Example:
2019 Q1: Average U.S. Household Wealth = $803.3K
Median U.S. Household Wealth = $112.5 K – GMM, Sep 2019
Even the MSM is now questioning the macroeconomic data because of our two-speed economy — one for the well-off and one for the not so — as exemplified in this New York Times headline, which we will address in a week or two.

The Average Stock Market Return of All Presidential Administrations
The same applies to average stock market returns, especially during presidential administrations, which are distorted, distributed and touted during election years.
So when we saw the following CNBC headline, which was then subsequently repeated in a presidential Tweet, we thought it necessary to dig deeper and use a little Sabermetric-esque analytics. We even provide you with some of the raw data as not to appear too partisan.
As Always
Just the facts ma’am — no obfuscation, twisted reality using distorted averages with outliers, and with context.

-
The S&P 500 has returned more than 50% since President Trump was elected, more than double the average market return of presidents three years into their term, according to Bespoke Investment Group.
President Donald Trump’s stock market stacks up well against the majority of his presidential predecessors.
The S&P 500 has returned more than 50% since Trump was elected, more than double the 23% average market return of presidents three years into their term, according to data from Bespoke Investment Group dating to 1928. — CNBC, Dec 26th
Really?
We haven’t tried to replicate the data in the article and do not doubt its veracity but do believe it needs some context to reflect current reality.
Beware Of Averages
Remember, if I am having a beer with a couple buddies at our local dive bar and we’re the only customers in the joint. and in walks Bill Gates, we are all now billionaires on average.
We show below that the first three-year performance of the S&P in three out of the last four presidencies equaled or outperformed President Trump’s stock market – i.e., Bush#41 to Obama.
Presidential Stock Returns
We have posted similar data but here you go again,

Dead Ball Era v. Juiced Economy & Stock Market
First, we thought it important to look at S&P500 returns (index changes) of post-WW II presidents. The S&P500 was created in 1957 and using the data, which was created a back history just doesn’t make us feel comfortable. The integrity of the data is always an issue, in our book.
Second, the context of the data is important.
Just as Sabermetrics makes the distinction of, say, home runs hit during the “dead ball” era, where the home run league leader hit less than 10 home runs during the entire season in 13 of the years between 1900-1920. Similarly, the economy and stock market are now “juiced” with large budget deficits, negative real interest rates, and quantitative easing. It is difficult to compare today’s stock market dynamics to that of President Harry Truman, for example.
Juiced
The average annual average budget deficit from Ike’s first administration to the end of the Carter administration was -1.2 percent compared to -3.3 percent from Reagan to Trump. Even excluding the outliers of the Clinton surplus years and Obama deficits after the Great Financial Crisis (GFC), the post-Carter average annual fiscal deficit still is 3 plus percent.
Enough has been said about our super juiced monetary policy, which we believe the genesis of the moral hazard with respect to the stock market began at the October 1987 stock market crash.
The Data
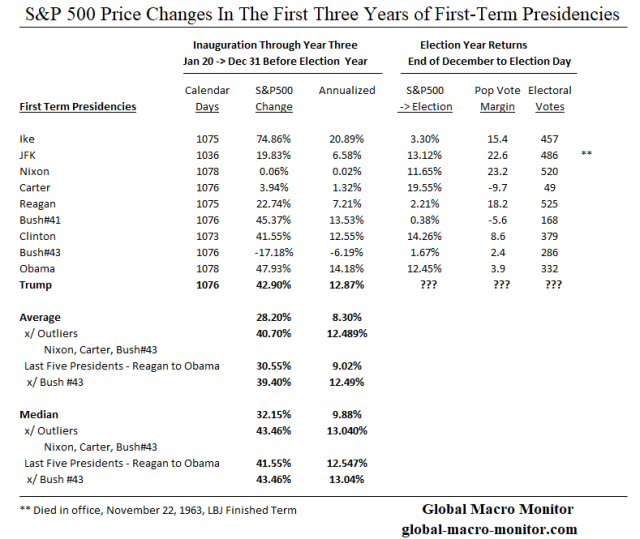
The data in the above table illustrate the change in the S&P during the first three years of a first-term president, from the close on the eve of Inauguration Day to the end-of-December before the election year. The price change has also been annualized.
We also look at the change in the S&P during the election year, from end-of-December until election day, the difference in the popular vote and the number of electoral college votes won. Some nice cocktail hour conversation.
Results – Outliers, Skew, and Distortions
For all first-term presidents since Ike, during their first 1070 plus days in office (Kennedy tragically cut short), the average change in the S&P500 is 28.20 percent. Note, however, the median change is 32.15 percent, significantly higher than the mean (average), which reflects a negative skew caused by a few negative outliers.
Given there have only been three presidencies since Teddy Roosevelt, who left office with a stock market lower than the one they inherited — Hoover, Nixon, and Bush#43 — it is also important to take these outlier data points into account, which causes significant distortions in the averages.
Results Excluding Outliers
Excluding the outliers of Nixon, Carter, Bush#43, the average change in the S&P500 for the six presidencies (excluding Trump) increases to 40.70 percent with a median return of 43.46 percent. The medium return exceeds Trump’s S&P, which contradicts the impression given by the CNBC article and the President’s Tweet.
Remember, many people have drowned at Coney Island Beach, which has an average depth of water of only 11 inches. How can that be?
This leads us to update our parable, The Central Tendency Problem Of A Seattle Dive Bar,
Central Tendency Problem & Stock Market Returns Of Last Five Presidents
Presidents Bush#41, Clinton, and Obama are sitting in a popular dive bar in Seattle after the stock market close on New Year’s Eve. It’s relatively early and they are the only patrons in Get Shorty’s.
Joe, the bartender, is a student at the University of Washinton studying statistics. The three Presidents are boasting about the stock market returns in their first three years in office.
President Bush#41 raises a glass to toast his stock market, “the S&P500 index was up 45.37% during my first 1,076 days in office.”
President Clinton brags, “my S&P was 41.55 percent!”
President Obama weighs in, “Gotcha all, the S&P500 was up 47.93 percent during my first three years.”
Joe, the bartender, brings out a Python program and calculates the average and median S&P500 index change of the three Presidents:
Change in S&P500 During First Three Years
Bush#41, Clinton, and ObamaAverage = 45.95 percent
Median = 45.37 percentPresident Trump = 42.90 percent
Suddenly, the door swings open and in walks President Trump, who sits at the bar, orders a Cherry Cola, whips out a copy of the CNBC article citing the data, “The S&P500 during my first three years in office has more than doubled the average market return of other presidents in during the same period.”
Joe’s project starts to get interesting. He shows President Trump the data that the S&P500 during his first 1076 days, the S&P500 actually underperformed the average of the other recent presidents sitting at the bar by more 200 basis points.
President Trump is shocked and shouts that is “fake news.” He lashes out, “You all need to read this CNBC article.”
Twenty minutes later, President Bush#43 walks in to have a pop (of water) with his fellow presidents.
Joe can’t believe all of the past five presidents are sitting at his bar. Now relieved after W. enters, he recalls #43 inherited a nasty bear market and left office eight years later in a nasty bear market. Surely, W.’s stock market return in his first three years will be such an outlier it will bring down the average S&P change for the other three presidents and calm an increasingly irritated President Trump.
Joe asked President Bush#43 what was the change in the S&P during his first three years.
W. responds, “I got screwed and inherited President Clinton’s bursting dot.com bubble and bear market. My S&P500 was down 17.18 percent. Darn it!”
Joe enters the data into his program and shows the results to President Trump,
Change in S&P500 During First Three Years
Bush#41, Clinton, Bush#43, and ObamaAverage = 29.42 percent
Median = 43.46 percentPresident Trump = 42.90 percent
President Trump begins to calm down. He then whips out his cell phone and commences to tweet out the data that the S&P500 in his first three years was 46 percent higher than the average of his four predecessors.
Upshot?
Know thy stats, especially as we enter a presidential election year and the decade of, what we believe, will be deepfakes.
Be skeptical and test all things, including our posts, folks.
More Data
Wait there is more.
The following table uses the Dow Jones Industrials to compute the returns during the various administrations going back to Teddy Roosevelt. The Dow was created in May of 1896 and none of the original stocks are still in the index after GE was given the boot in June 2018.

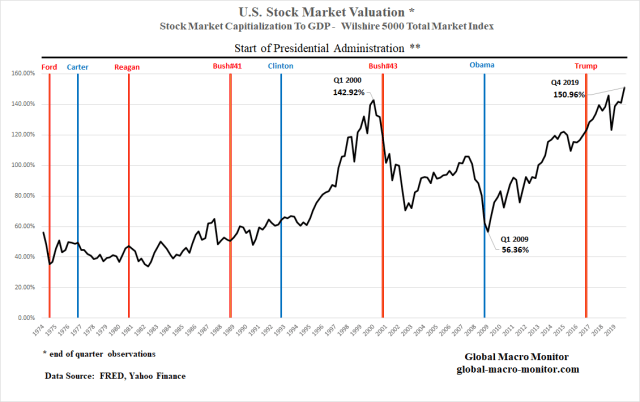
We have also added some context in terms of valuations as illustrated by the last two columns. It is our favorite stock market valuation metric — the stock market cap to GDP ratio — using the Wilshire 5000 Total Market index in the numerator. The Wilshire 5000 index was created in 1974.
What stands out is that both President Trump and President Bush#43 inherited an extremely overvalued stock market, 116 percent of GDP, which is why we are pretty bearish on the eventual terminal point for Mr. Trump’s S&P. The stock market cap to GDP ended 2019 at 150 percent. Stunning and can you say, “Yikes!” See the Market Valuation chart below.
Are Democrats Or Republicans Better For The Stock Market?
We will let the facts speak as not to be accused of partisanship. We encourage you to recreate the results for yourself. We also stress context as presidents cannot control the stock market, well, except maybe the current one, and look at the valuations each president inherited and left to his successor, for example.
Note, the data are price changes and do not include dividends.

The facts are there have been 12 Republican and 8 Democratic presidents since Teddy Roosevelt assumed office after the assassination of President McKinley. The Republicans have held office almost 53 percent of the 43k plus calendar days.
Only three presidents have experienced negative stock markets during their entire term, all Republicans — Hoover, Nixon, and Bush#43.
The average change in the Dow during Democrat administrations is 92 percent, more than double the average of Republican administrations.
How could that be? It is so the opposite to the perceived conventional wisdom? Outliers?
Stay tuned.


Pingback: This Week’s Best Investing Articles, Research, Podcasts 1/10/2020 - Stock Screener - The Acquirer's Multiple®
Pingback: Average Hourly Earnings Up 4.7 Percent In One Month?
Pingback: Average Hourly Earnings Up 4.7 Percent In One Month? | Global Macro Monitor