
I’ve seen fire and I’ve seen rain. I’ve seen manias the public thought would never end. Until they do.
This ain’t our first rodeo. We have seen these types of asset bubbles many times during our career, especially when you include our emerging markets daze. We have learned two certainties:
- Valuations are the gravity that ultimately brings markets back to reality, i.e., asset prices regress to mean valuations
- Very few, and mostly liars top-tick and always get out at the top
The young Python Algo ‘bots driving stocks do not have this kind of context or history.
Supply Driven Bubbles
The current bubbles are slightly different in nature as we perceive them driven by the new supply-side economics, where both public and corporate policies have induced asset shortages of risk-free bonds, stocks, and affordable housing. They are more steely, more difficult to pop, and last longing than most think they can. Until they don’t.
Trading Versus Investing
We do recognize trading is different from investing. Good traders can flip cotton or cotton candy for a profit but even that is getting increasingly difficult with the rise of the ‘bots in this modern-day aglo driven market. We traded “billions and billions” of Apple stock each year during the company’s high growth days back in the day. And that was just Apple. No more.
Buy Low, Sell High
Though we have taken stabs at shorting this mania, we have learned some expensive lessons over the years about “Milton” Keynes‘ (no, not the town in Buckinghamshire, England) dictum,

A lesson now being learned by the TSLA shorts, by the way.
Chart Numero Uno
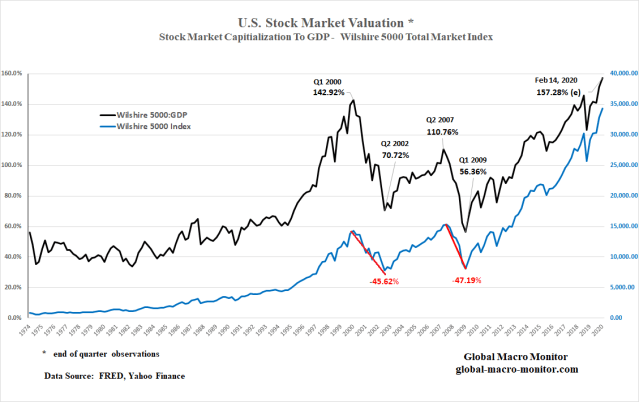
We have posted this chart — one of Warren Buffet’s favorite macro valuation metrics — many times but it still holds. The black line can’t continue to climb from lower left to upper right forever as stocks eventually have to track the underlying fundamentals of the economy. Whereas the natural trajectory for a stock index such as the Wilshire 5000 (blue line) is lower left to the upper right on the chart. The higher the black line moves above past highs, the harder and more painful the fall, or a meaner regression to the mean.
Write that down, folks.
The question is have stock valuations “reached a permanently high plateau” as the famous economist, Irving Fisher, stated just a few weeks before Black Thursday 1929?
Believe it, if you wish. After all, we now live in a culture and political environment where,
To that, we say hogwash.
We don’t know the exact point where the market tops but we will see you on the beach until it does.
Chart Numéro Deux
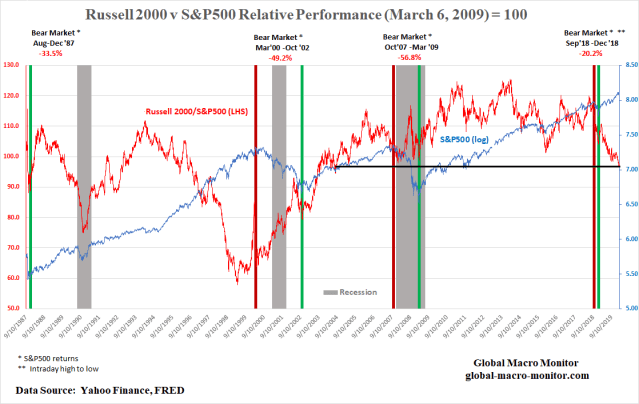
We have also put together the above chart illustrating the relative performance of the small caps, the Russell 2000 index versus the S&P500 (red line). Notice before every bear market and recession the small caps begin to significantly underperform the S&P500. Kinda like the current environment.
Does the chart then reflect an imminent recession and bear market? We don’t know but it is another warning sign flashing caution.
Best Economy Ever?
Is it possible the above charts reflect a market in the midst of the best economy ever?
We don’t think so.
In fact, the economic performance of the past three years looks very similar to the prior three years, if not a bit less robust. The table below illustrates the 27 bps of higher annual real GDP growth over the past three years comes at a very steep cost — a 1.7 percent of GDP increase in the federal budget deficit. Not exactly a productive expansion of the public debt, in our opinion.
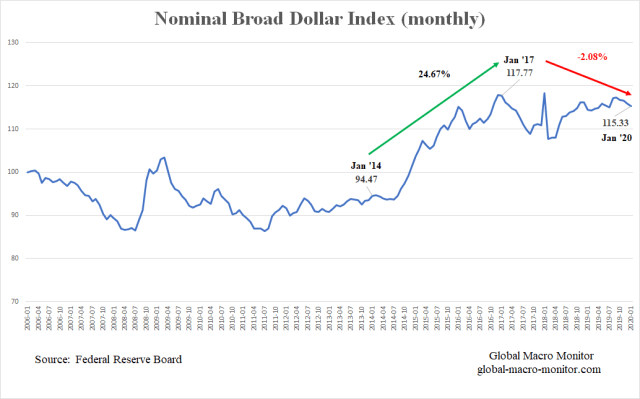
The 2014-2016 economy was also facing a massive headwind of a strengthening dollar with the trade-weighted broad index increasing by almost 25 percent in the three years.
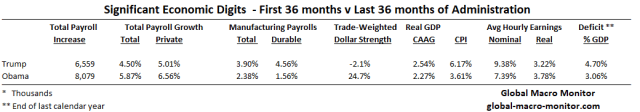
We have analyzed the significant impact and correlation of dollar strength on manufacturing payrolls, especially in machinery.

There you have it, folks. Not if, but when.
Until then, see you on the beach.
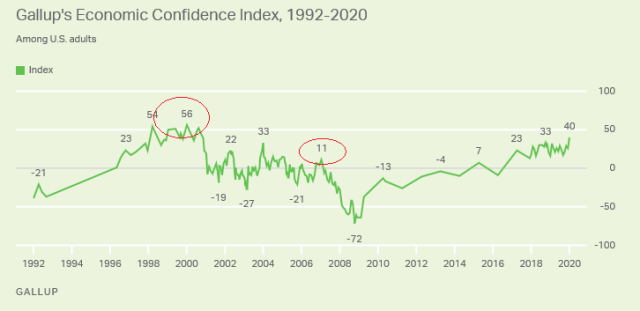
P.S. Just one more thing. The Gallup chart on Economic Confidence has traditionally been a contrarian indicator.


Pingback: Trump & Co Must Abandon The Stock Market To Save It | Global Macro Monitor
Pingback: A Long Way To The Bottom For Stocks | Global Macro Monitor
Pingback: The Stock Market’s Gas Gauge | Global Macro Monitor
Pingback: Long Pitchforks And Water Cannons | Global Macro Monitor
Pingback: Long Pitchforks And Water Cannons | WESTON POST
Pingback: Long Pitchforks And Water Cannons – iftttwall
Pingback: Long Pitchforks And Water Cannons – SYFX+
Pingback: Long Pitchforks And Water Cannons – MDC News Today
Pingback: Long Pitchforks And Water Cannons | Real Patriot News
Pingback: Long Pitchforks And Water Cannons – Patriot Powerline