
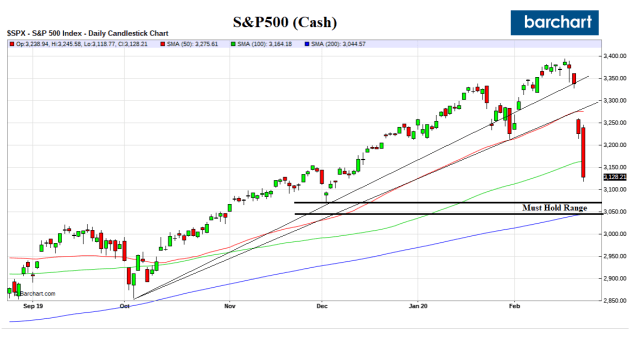
Ugly two daze of trading. In fact, two of the four largest point drops in the history of the Dow Jones Industrial Index. The S&P500 is now sitting right on a key Fib level at 3124.74.
Now What?
A bounce is coming. It’s the quality of that bounce that counts.
All the disciplined trend traders have been blown out and the market is still far from cheap.
The first stop to the upside is to recapture the 100-day at 3164.18. Then the key fibs at 3183.61 and 3188.17.
To the downside, the December low at 3077.33 is an absolute must hold with the reinforcement wall at 200-day at 3044.57. That is less in percentage terms than today’s sell-off.
“That was conveyed to me by a guy named Lucien Hooper, who was a contributor to Forbes and worked for Thomson Mckinnon Securities, back in 1971,” said Saut. “If that December low is taken out to the downside in the first quarter of the new year, watch out.” – Jeff Saut, CNBC
The point-blank range is now 3044.57-3077.33. Keep it tight, folks.

Note Trump’s stock market owns the nine largest Dow flops.


