
The gold move has been astounding but not surprising. In our book, the main driver of gold is the perception of the central bank’s commitment to maintaining the purchasing power of its fiat currency. Unless the Fed panics and begins to shut down the digital printing press, gold is moving much higher.
The chart below illustrates the measured move target to 2793.90, which simply adds the move from the Sep ’11 high to the Dec ’15 low to the Sep ’11 high.
Gold, baby.
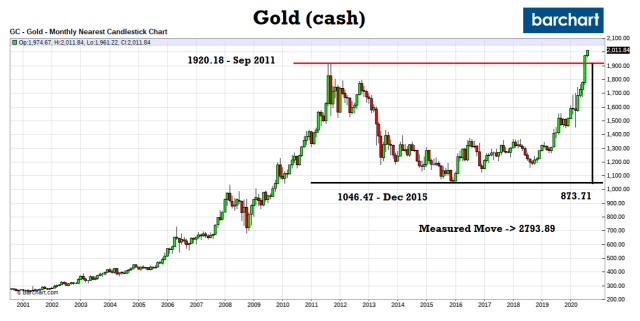


Actually it’s headed to $3,330. Take the 873.71, multiply it by 2.618 and you’ll get 2,287.37. Add that to the 2015 low of 1,046.47 and you’ll get $3,333.84.
You can do the same thing with the drop from the 1980 high of 873 to the 1999 low of 253. That projected a move during the last cyclical bull (1999-2011) to $1,876. The actual high was $1,920, exceeding the calculated target by 2.34%. I expect much the same from the new cyclical bull market in gold that began in December 2015.
I like it. Thanks, Robert.
Pingback: This Week’s Best Investing Articles, Research, Podcasts 8/7/2020 - Stock Screener - The Acquirer's Multiple®