
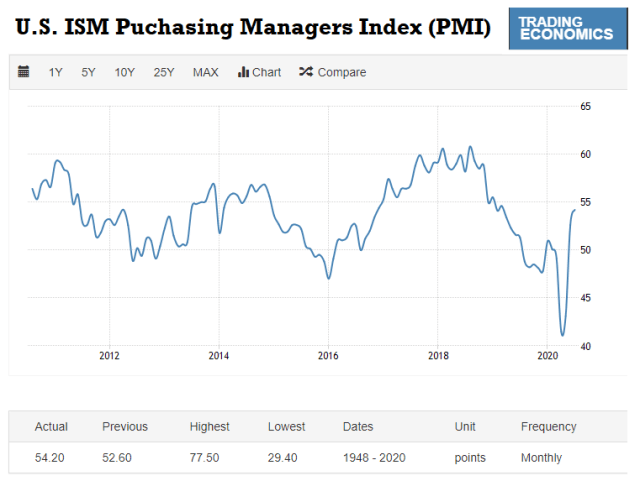
Purchasing Managers’ Index (PMI)
The headline PMI is a number from 0 to 100. A PMI above 50 represents an expansion when compared with the previous month. A PMI reading under 50 represents a contraction, and a reading at 50 indicates no change. The further away from 50 the greater the level of change. – Investopedia
We had to post this after hearing a market talking head rationalizing the big stock market moves based on,
“The data is good. The U.S. PMI hasn’t been this high since November 2018.”
It’s time for a reality check and some Will Rodgers,
It isn’t what we don’t know that gives us trouble, it’s what we know that ain’t so. – Will Rodgers
By definition, the PMI is a diffusion index designed to measure the prevailing direction and robustness of the month-to-month changes in manufacturing.
July’s PMI has zero relationship to the “November 2018” PMI except for the fact both months were expanding compared to the prior month. The relative levels mean absolutely nothing.
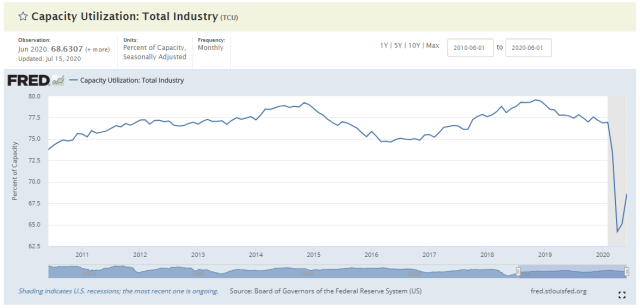
The July PMI comes in “strong” yet factories are still operating at much lower capacity than they were in November 2018.
Upshot
Avoid the dumb-dumb pills of the talking heads, think and analyze for yourselves, folks.
We will get the same bullshit noise after Q3 GDP prints at around 20 percent. on October 29th, just five days before the election.
“the largest and strongest quarterly GDP expansion on record!”
It will be true as a stand-alone statement, in fact, double the next strongest quarterly annualized expansion of 10 percent in Q1 1958, but please keep it in context.
We preach a lot about “context” at GMM. The strong Q3 GDP print will come after,
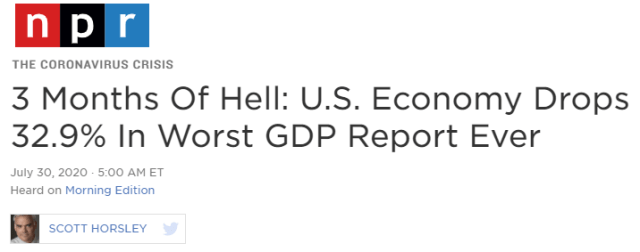
See the article here
So, even if Q3 GDP comes in with the “greatest expansion ever” at 20 percent annualized, real output (GDP) in the U.S. will still be 6.35 percent below Q4 2019 GDP.
Why Markets Crash
It is also important to realize markets like to move on first derivatives (changes in levels) and tend to ignore levels, such as valuations until they do. One of the reasons why markets tend to crash and experience more left tail outsized events than statistics would suggest.
One last thing,
Beware of Semantic and Quantitative Fascism
The economy, as a whole, is not strong.

