
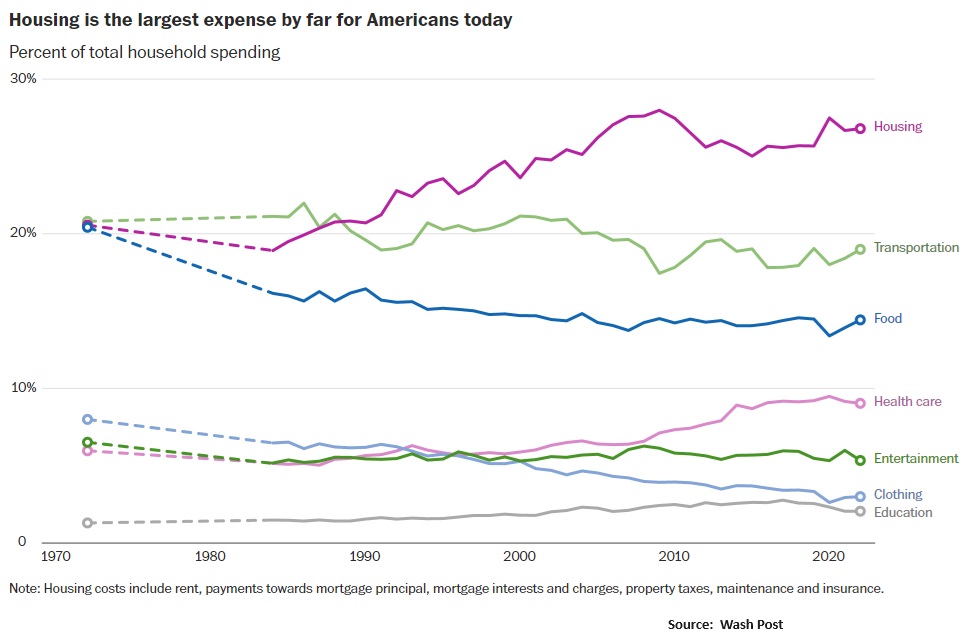
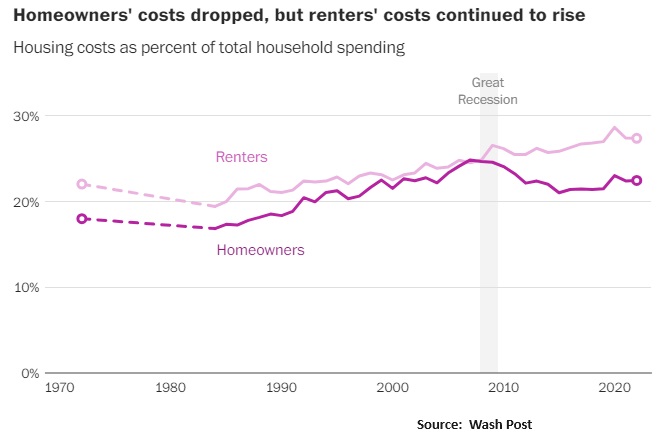
Over the past fifty years, American household spending has significantly changed due to technological advancements, globalization, and evolving socio-economic factors. Housing costs have dramatically increased, consuming 27% of household budgets today compared to 19% in 1984, fueled by the chronic housing shortage and escalating construction costs. Conversely, food expenditures have decreased from 20% to 14% of household budgets, thanks to efficiency gains in agriculture that have halved food costs since 1972. Healthcare spending has surged, driven by industry consolidation and increased demand for medical services, despite technological advances that have generally curbed costs in other sectors. Healthcare spending per capita in the U.S. is nearly double that of other wealthy nations.
Clothing expenses have plummeted due to globalization and the outsourcing of production, which has reduced prices but drastically lowered the proportion of garments made in the U.S. In 1972, most, if not all, clothing was made in the United States. Today, the share is around 3 percent.
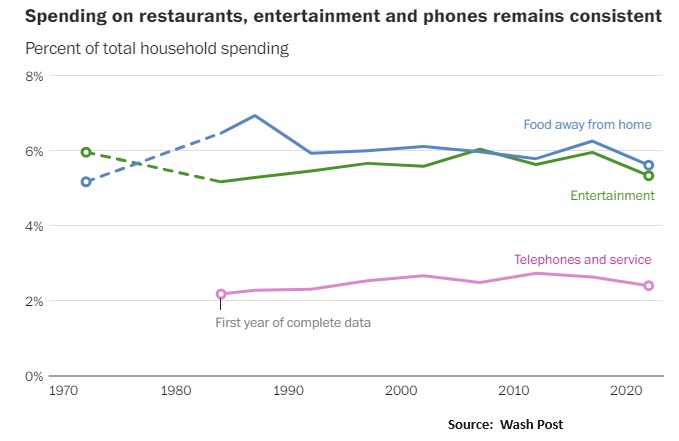
Meanwhile, spending on entertainment and dining out has remained stable, reflecting enduring consumer value in these categories. The shift towards mobile communications from landlines illustrates the impact of technology on consumer habits. Healthcare is expected to claim an increasing share of consumer budgets, particularly as the population ages, signaling continuous growth in healthcare demand. These shifts offer a clear view into the evolving priorities and economic pressures shaping American life.
- Housing Expenditure Rise: Housing expenses have increased from 19% of a household’s budget in 1984 to 27% today.
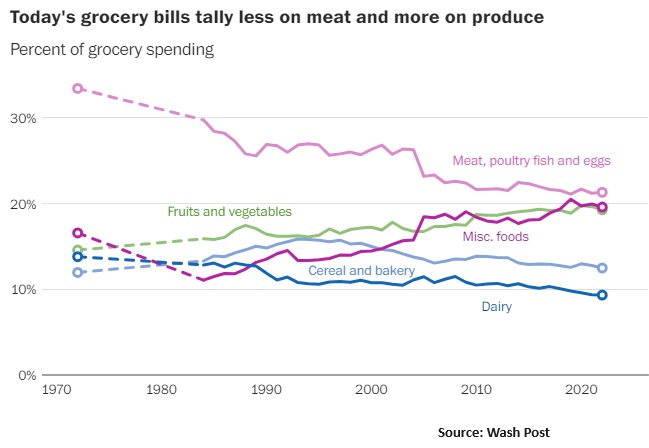
- Decrease in Food Spending: The proportion of income spent on food has declined from 20% in 1972 to 14% due to increased agricultural efficiency. Farms are more than twice as productive as they were in the 1970s.
- Healthcare Costs Surge: Healthcare spending has grown significantly, fueled by industry consolidation and increased demand for medical services.
- Globalization Impact on Clothing: The share of clothing made in the U.S. dropped from nearly 100% in 1972 to 3% today, with consumers buying more but spending less due to overseas manufacturing.
- Stable Entertainment and Dining Costs: Spending on restaurants and entertainment has remained relatively constant, indicating sustained consumer interest.
- Technological Transformation: Shifts from landlines to cellphones and data plans have kept communication spending stable despite technological changes.
- Education Spending Increase: More Americans are pursuing higher education, leading to increased spending in this sector.
- Efficiency in Vehicle Expenses: Households own more cars yet spend a smaller portion of their budget on them, thanks to manufacturing efficiencies.
- Rising Miscellaneous Expenses: A notable increase in spending on prepared foods and snacks reflects a shift towards convenience.
- Future Healthcare Spending: Experts anticipate healthcare will continue to consume a larger portion of household budgets, particularly as the population ages.
The above analysis summarizes a recent article in the Washington Post. The data are from the Bureau of Labor Statistics’ Consumer Expenditure Survey


Thanks for the data!