Another Potemkin Trade Deal

Chalk up another meaningless, photo-op trade agreement with the recent U.S.-Japan Trade Agreement.   The country and, especially, American farmers would have been much better off staying in the Trans Pacific Partnership (TPP).

The Japan deal is just another Potemkin trade agreement that will not move the needle one centimeter in bringing jobs back to the United States as was promised.

Free Trade

The dominant loop in the algo to predict President Trump’s behavior with respect to just about everything is to reject all things Obama even if it damages the country.  It’s really not rocket science, folks.

Here’s Forbes on the Japan trade deal,

Japan trade

If you’re looking for evidence that a U.S.-China trade agreement is a pointless exercise in economic futility, consider Donald Trump’s non-deal with Japan.

…Late last month, he [Abe] gave Trump a “deal.” That, Trump figured, would enable him to claim a much-needed win on the global stage and get his impeachment troubles out of the headlines. Knowing this, Abe’s team skillfully watered down the deal—essentially to TPP levels. All it means is that U.S. farmers missed out on nearly three years of increased access to Japan, Australia, Singapore, Malaysia, Chile and elsewhere.

Yes, the man famed for the ghostwritten bestseller Art of the Deal got played by Japan’s negotiators. And soon, Xi Jinping’s trade team will be able to make the same boast. Any U.S.-China deal will be a cosmetic affair that gives Trump a “win” and President Xi clearance to make China’s rise great again.

Trump is desperate for a face-saving way to end the trade war. Fallout on U.S. farmers and consumers paying higher import prices is imperiling Trump’s reelection odds for 2020. Yet backing down to Beijing would create its own problems with Trump’s base. Xi’s men are well aware of this, just like Abe’s.  – Forbes, Oct 8th

We have been very critical of the Administration’s trade policy simply because there is none.

Posted in Trade War, Uncategorized | Tagged | 6 Comments

It Begins


It is starting to get real, folks.  The U.S. is in the midst of a major and potentially very destabilizing Constitutional Crisis.

Don’t listen to the talking heads flapping their jaws.   Everything is not awesome.  Any strength or rallies are a gift to reduce risk and/or get shorty.  Buckle the f$&k up!

Seat Belts_Mar24


Posted in Uncategorized | Leave a comment

How The Rich Get Richer And The Poor Get Poorer

The power is off in Northern California but we want to get this out even though it is still in draft form.  We are working off the desk and not sure when power will be restored.  Take this as our first cut or swing in one of four at-bats.   

Summary
– We analyze the various components of the household balance sheet that drove net worth for the different percentile groups from Q1 2000 to Q1 2019
– The Top 1% are the ownership class, who hold over 60 percent of their assets in equity, in both public and non-corporate business and have benefited greatly from QE
– The Bottom 50% of households have not benefited from the great asset inflation of the past ten years as their debt liabilities have exceeded the 93 percent growth in assets, resulting in an 8.6 percent decline in net worth from Q1 2000 to Q1 2019
– This post is a work in progress.  Stay tuned for further updates when they turn the power back on in Northern California 

In keeping our commitment we made to GMM readers in the post, America’s Perilous Path Of Wealth Distribution,  we have another follow-up with some additional and very interesting data on wealth distribution in the United States.    If you haven’t read our previous posts, run don’t walk for some deep background to this piece.  Here are the links,  America’s Perilous Path Of Wealth Distribution and  Wealth Distribution In America

Review 

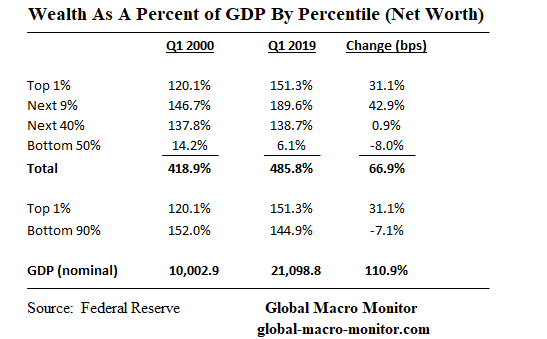
In the previous posts, we illustrated America’s growing wealth gap, where the the Top 1% of households now hold more wealth than the Bottom 90%.   The Top 1% are households with a net worth north of around $11-12 million.  We use the terms wealth and net worth interchangeably.


Wealth_Table_1


Wealth distribution in America is even more acute when comparing the 165.6 percent growth of the net worth for the Top 1% relative to the stunning  8.6 percent decline of the Bottom 50% of households.   Yes, you read that correct, the aggregate nominal wealth of the Bottom 50% of American households has fallen almost 10 percent over the past 20 years, which is politically destabilizing and explains much of the conflict in today’s body politic.

Wealth_T_Oct_1

In this post, we look at the composition of wealth by asset class and the contribution each has had to the change to the net worth for each percentile group from Q1 2000 to Q1 2019.

Stock Versus Flows

We only look at the change in the stock of assets and liabilities for each household percentile group, which includes the combination of capital gains, the cumulative income from assets, and the accumulation of new asset purchases with savings out of income.    The data is not easily available to breakout the later, so keep in perspective the data includes capital appreciation, asset income,  and the accumulated flow of new savings from income over the years.  That is the absorption of cumulative savings and thus implicit income growth over the time period.

The above complicates our wealth distribution analysis as households can move from, say, the Bottom 50% to the Top 1% by hitting the lottery, for example.  In a more real-life example, one of my daughter’s classmates who was a first-round pick in the recent Major League Baseball draft woke up one morning as a starving college student and went to bed that night with a $7.8 million contract, including a huge signing bonus.   Definitely,  a meteoric rise from the Bottom 10% to the Top 10%, assuming he and his girlfriend are counted as a household by the Census Bureau.

Income, savings, and the allocation of savings matter big to wealth accumulation.  What matters even more is building and maintaining wealth.

Liabilities 

Since liabilities also play a role in determining net worth, we also have a brief look at household liabilities.

How The Rich Got Richer 

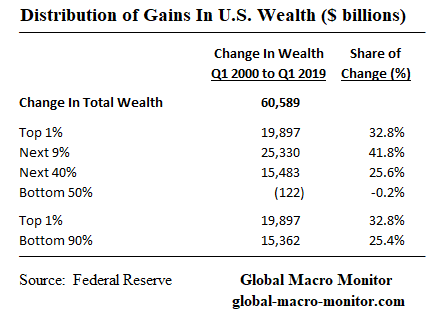
The following chart illustrates the aggregate nominal wealth of the Top 1% of households increased by $20 trillion, 165.6%,  from $12 trillion in Q1 2000 to $32 trillion in Q1 2019. Most of the increase, 60.6 percent,  came from the appreciation and accumulation of public equities and equity in non-corporate private business:  $7 trillion and $4.7 trillion, respectively.


HH_NW_2000_2019_Top1

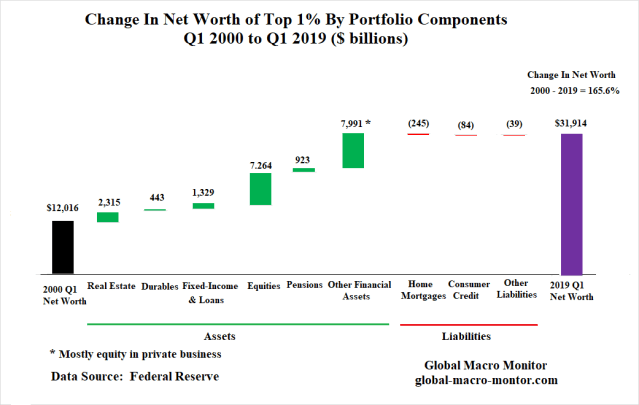
Real estate holdings accounted for 11.6 percent of the change in net worth and fixed-income assets 6.7 percent.

Impact of QE

How much of the Top 1%’s increase in wealth was due to the Fed’s monetary policy of quantitative easing (QE)?  We can’t really quantify at this moment and will leave it for a future analysis but it is fairly safe to say, a lot.   The Top 1% have effectively become asset surfers riding QE to unfathomable riches!

Is it any wonder why support is increasing for a People’s QE?

Liabilities

The Top 1% of households carry very little debt, less than 2 percent of total assets.

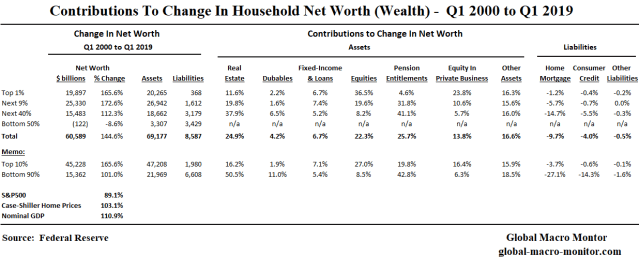
Contributions To Net Worth By Household Percentile Group

Asset_Contribution to NW

How The Poor Got Poorer

Though the assets of the Bottom 50% of households increased by $3.3 trillion, or 93 percent, over the period, the group’s net worth still fell by almost 10 percent because of their change in debt liabilities exceeded the increase in assets.

HH_NW_2000_2019_Bottom50

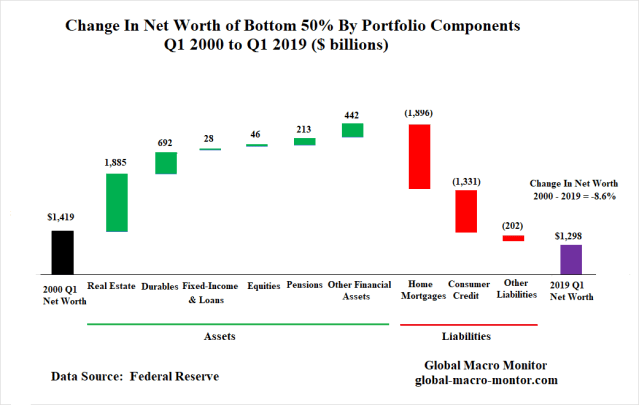
Almost 80 percent of the $3.3 trillion increase in assets was in real estate and consumer durables, such as cars, which illustrates just how little the Bottom 50% are invested in the financial markets.  Only 2.9 percent of the group’s assets are held in equities and 9.8 percent in pension entitlements (see Asset Allocation chart below).

Liabilities And The Dusenberry Effect

Some of the increase in liabilities over the period was student loans, which we believe, are included in consumer debt.

We were surprised to find that even at the apex of the housing bubble, when the value real estate assets of the lower 50% were growing double digits, aggregate net worth was declining as the group’s borrowing exceeded asset growth.  We suspect it was due to leveraging and using their home equity to finance additional purchases of homes and/or using it as an ATM to finance consumption.   Moreover, the toxic mortgage debt that was marketed to the lower-income groups also played a role, such as 12o percent mortgages and option ARMs.

Stagnant Real Wages

Just a quick note on relative real wage growth from 1979 to 2018 from the Congressional Research Service (CRS),

Real wages rose at the top of the distribution, whereas wages stagnated or fell at the middle and bottom. Real (inflation-adjusted) wages at the 90th percentile increased over 1979 to 2018 for the workforce as a whole and across sex, race, and Hispanic ethnicity. However, at the 90th percentile, wage growth was much higher for white workers and lower for black and Hispanic workers.  By contrast, middle (50th percentile) and bottom (10th percentile) wages grew to a  lesser degree (e.g., women) or declined in real terms (e.g., men). – CRS

We also suspect declining real incomes in a large portion of the Bottom 50% of households resulted in the Dusenberry Effect, where households took on more debt to sustain a fleeting standard of living,

One part of the “Dusenberry Effect” basically states that consumers do not give up their consumption patterns very easy even if their incomes decline.   They, in effect, “ratchet” down their living standard very slowly by first having a second wage earner enter the workforce as we saw in the 1970’s when women began to enter the workforce en masse and then by taking on debt to finance their previous standard of living.  — GMM,  August 2017

Whatever the case, the Bottom 50% carry a huge relative debt burden, 81.1 percent of assets, compared the 17.1 percent of the households in 50-90% percentile, the next most indebted group.

Asset__Liability_Profile_By_Percentile Group

The data also clearly illustrates why debt forgiveness is a major focus of today’s populist message,  even among the so-called moderate presidential candidates.

Debt Forgiveness

Democratic presidential frontrunner Joe Biden laid out his higher education platform today. There’s a lot in there, but I want to focus on one part: his proposal to make the income based-repayment (IBR) program for federal student loans more generous by cutting payments to just 5% of discretionary income. — Forbes, October 8th

When The Bottom 50% Was Insolvent

In an earlier post, we showed how the Bottom 50%, on an aggregate basis (i.e., not every household) was insolvent during several quarters just after the financial crisis. Interestingly, we found what initially brought the percentile group back above water was a sharp reduction in its liabilities, which we suspect was getting out from under their bad mortgage debt either through foreclosures or debt forgiveness programs.


Insolvent


Household Allocation Of Assets

We leave you with the following data on how each percentile group’s assets are allocated.  When the power comes back off we’ll have more commentary.

Main Observations
– The Top 1% are the ownership class, holding 60 percent of their assets in equities and equity in non-corporate businesses
– Pension entitlements make up almost 30% of the assets of the 90-99% percentile of households with 40% of their assets allocated to equities and real estate holdings
– The 50-90% percentile group hold almost two thirds of their assets in pensions and real estate with only 8.6 percent held in equities 
–  More than 70 percent of the Bottom 50% assets are held in real estate and consumer durables, such as autos, and only 2.9% in equities

Asset_Allocation_By_Percentile Group


Asset_Allocation_1%


Asset_Allocation_50%


Asset_Allocation_Total

Growth Of Asset Holdings

Interesting that the net worth of the top three percentiles outpaced the S&P500 and the Case-Shiller national home price index.  This clearly reflects the accumulation of assets through savings.   Also interesting the outsize growth of short-term assets by the Top 10%, which partially reflects the start date was the March 2000 peak of the dot.com bubble and the latest news that the rich are now hoarding cash.


Asset_% Assets

Upshot

It’s coming in the final print.  Stay tuned.

Running Out Of Free Lunches

We are almost out of free lunches, folks, and will be posting only sporadically unless your support increases.   Donate whatever you think is fair by clicking on the PayPal button just below the Twitter and search icons on the upper right-hand side of the blog.  You do not need a PayPal account and can use almost any credit card.

Don’t be a free rider.  Thanks, so much.

free rider

Posted in Uncategorized | 15 Comments

Private Sector Job Growth

Just a follow-up chart to our weekend post, Job Creation: Reality v. Politics,  to reflect the sharp downshift in private-sector job creation.  The 3-month moving average of the monthly change in total private-sector payrolls is now at its lowest level since July 2012.

As we said, it is a difficult proposition to generate robust job growth with a shrinking labor pool and an unemployment rate at 3.5 percent, which we believe is a flawed and misleading measure of the true picture of the labor market.  See here

BLS_Private Sector Growth

Posted in Uncategorized | Leave a comment

Walmart Nation Continues To Bleed Jobs

Just an update on our last post, Trouble Coming To Walmart Nation?  Warehouse clubs and supercenter retailers continue to shed workers.   Along with being Amazoned, the big box retailers are adopting automation at a lightspeed pace and have cut over 42k jobs in the last 12 months.

On Friday, the BLS reported the retail sector lost another 11.4k jobs, the 8th consecutive month of payroll losses.  Retail is one of the country’s largest employment sectors, ranking 4th behind education & health, professional & business services, and leisure and hospitality.

Moreover, Walmart is not only the world’s largest private employer but the largest employer in many states throughout the United States.

largest-employers_jan26


Walmart

Posted in Uncategorized | 9 Comments

Job Creation: Reality v. Politics

A nice chart for those who live in a fact-based world.

Job creation in the first 32 payroll reports in the Trump administration is significantly lagging the prior 32 months before President Trump took office.


Trump v Obama

Employment Situation – September

On Friday,  the BLS reported a total nonfarm payroll monthly increase of 136k, including 114k private-sector jobs;  an unemployment rate falling to 3.5 percent, the lowest rate since December 1969, and average hourly earnings falling by 1 cent.

The BLS notes a big downshift in job creation from last year,

Total nonfarm payroll employment increased by 136,000 in September. Job growth has averaged  161,000 per month thus far in 2019, compared with an average monthly gain of 223,000 in 2018.  – BLS

Private Sector NFP Creation Lowest 3-mo MA Since 2012

September’s 114k monthly increase in private sector payrolls was the fifth-lowest of the Trump administration and, more disturbing, the 3-month moving average of private-sector job creation is now at its lowest level since July 2012.

To be fair, robust job creation is a difficult proposition when labor supply is so scarce as measured by a 3.5 percent unemployment (UR), though we believe the UR is a flawed measurement.  See here


NFP

The New Political Spectrum 

We are starting to wonder if facts matter anymore.

The post-modern nightmare now seems fully realized in today’s culture, where there is no reality only constructions of reality.  There is no truth, there are no facts.  It’s true only if you believe it’s true.

We reject this nonsense and are becoming convinced the new political spectrum is not about the left and the right anymore but it is bookended by a fact-based reality versus the conspiracy dominant, or, what we call the National Enquirer based.

Poltical Spectrum


Many from the traditional left and right live together, though not in agreement, on both extremes of the spectrum.   Our preference is for a fact-based lefty or righty over the alternatives any day.

Reality is a much easier reality and a better world when the facts are established and the conclusions are debated rather than arguing over two or many different realities.  Unfortunately, we are seeing this now play out in real-time in the U.S,, which is very destructive and, if not checked, will end up in economic disaster.

Lincoln And The Facts 

President Lincoln,  a great storyteller, had something to say about drawing different conclusions from the same established or, what economists like to call “stylized facts,”

During his days as an Illinois circuit court lawyer,  legend has it Lincoln would persuade juries with the use of his funny but truth piercing stories,

The story goes that Lawyer Lincoln was worried he had not convinced the jury during the closing argument of a civil case against a railroad.   The jurors had gone to lunch to deliberate.  Lincoln followed them and interrupted their dessert with a story about a farmer’s son gripped by panic,

“Pa, Pa, the hired man and sis are in the hay mow and she’s lifting up her skirt and he’s letting down his pants and they’re afixin’ to pee on the hay.” “Son, you got your facts absolutely right, but you’re drawing the wrong conclusion.”

The jury ruled in Lincoln’s favor.

Just the facts, ma’am!

Posted in Employment, Uncategorized | Tagged , , , | 3 Comments

The Rise Of Deep Fakes

Time to question everything, folks.

Deepfakes have started to appear everywhere. From viral celebrity face-swaps to impersonations of political leaders – it can be hard to spot the difference between real and fake. Digital impressions are starting to have real financial repercussions. In the U.S., an audio deepfake of a CEO reportedly scammed one company out of $10 million. And with the 2020 election not far off, there is huge potential for weaponizing deepfakes on social media. Now, tech giants like Google, Twitter, Facebook and Microsoft are fighting back. With Facebook spending more than $10 million to fight deepfakes, what’s at stake for businesses, and what’s being done to detect and regulate them?

» Subscribe to CNBC: https://cnb.cx/SubscribeCNBC

Posted in Uncategorized | Leave a comment

QOTD: Foreigners RSVP For 2020 U.S. Election

Are you surprised?  The government has all but put out the welcome matt.

In addition to Iran, hackers from North Korea and Russia have already started targeting organizations that work closely with 2020 presidential candidates. – NY Times

Posted in Uncategorized | Leave a comment

Trump Is Now Compromised In China Trade Talks

The road to a credible China trade deal just got a bit narrower and bumpier after President Trump all but recruited China for his 2020 campaign.  China may not accept but they do now have a tremendous amount of more leverage.   Don’t tell that to Mr. Market, which closed at its high of the day, however.

It is also going to be hard for the body politic to now trust that POTUS is not self dealing in trade negotiations. whether true or not.  Perception is everything in politics.

Drudge_China Recruitment

The rabbit hole just gets deeper and darker every day, and the path to extraction goes more foggy on the hour.

China should start an investigation into the Bidens,” Trump said in remarks to reporters outside the White House. Trump said he hadn’t directly asked Chinese President Xi Jinping to investigate Biden and his son Hunter but it’s “certainly something we could start thinking about.” – AP

We do wonder how long the American public will maintain confidence in POTUS to negotiate for them in good faith,  especially now to secure a “good” trade deal for the country?   If the Trump team makes concessions to China, it could raise doubts they went easy in order to get some oppo for his campaign, for example.   That weakens the American negotiating position and lessens the chance of a deal.

Update 8:04 pm Eastern

This just in,

During a phone call with Xi on June 18, Trump raised Biden’s political prospects as well as those of Sen. Elizabeth Warren, who by then had started rising in the polls, according to two people familiar with the discussion. In that call, Trump also told Xi he would remain quiet on Hong Kong protests as trade talks progressed.  –  CNN

Elizabeth Warren?

The fact he sold the young people fighting for democracy in Hong Kong down the river is no surprise to us.  We posted about this in August.  See here.

Biden And The Swamp

We have no doubt the arms of the People’s Liberation Army (PLA) intelligence agency,  including the MSS, have the sophistication and technology to cook up, say, a deep fake video of Hunter Biden even bribing Jesus and generating a viral sensation on social media.

Or the Chinese could blackmail the Trump administration with the threat of releasing propaganda, such as a deep fake video of one of the negotiators offering a quid pro quo, say, easing up on Huawei for help with the campaign.

Yes, the whole Biden story of working for a Ukrainian gas company thing is extremely swampy, but not illegal, and will, if not already, hurt Uncle Joe’s campaign.

Ivanka’s China Trademarks 

Hunter Biden’s swampiness pales in comparison to that of POTUS and family, however,

President Donald Trump’s daughter and senior advisor, Ivanka Trump, last month won initial approval from the Chinese government for 16 new trademarks, covering a wide range of products that include “voting machines.”

Since she has retained her foreign trademarks, the public will continue to have to ask whether President Trump has made foreign policy decisions in the interest of his and his family’s businesses,” CREW said in a post. “Her trademarks remain a potential conflict of interest as she continues to work on policy in the White House and meet with foreign leaders.” – CNBC

Seriously, voting machines?

The above graft may be downright illegal if not unconstitutional.  Doubt if the Department of Justice will investigate it, however.

Federal Election Commission

We leave you with the following tweet sent out this morning by the Chairman of the U.S. Government’s Federal Election Committee, Ellen Weintraub, just shortly after President Trump recruited China to his campaign.

For the Fox News viewers,  if you’re listening,  President Trump is reaching out to China for help on his campaign.   That is the Chinese Communist Party (CCP)!

Does Trump Have A Samson Complex?

It is hard to comprehend the current state of American politics, especially after what President Trump did today.  It appears now even the Drudge Report, which has a tremendous influence on the Alt-Right and led the charge on the Clinton impeachment, is starting to turn on him.

We saw how the President seemed to throw the VEEP under the bus the other day.

This leads us to ask the question: Does the President of the United States have a Samson Complex and is hellbent on taking down everyone and everything down with him?

…the life story of a psychotherapy patient to that of biblical Samson reveals that both men suffer from a behavioural disturbance, manifested in the compulsion to re-enact the experience of betrayal by women [Nancy Pelosi?], followed by destructive attacks of rage against others, and ultimately against their own tormented selves.  — Journal Of Medical Psychology

Rick Wilson, the Republican strategist seems to think so.   Similar to the biblical story,  where the blinded and shorn Samson says, “Let me die with the Philistines,” and then brings down the temple on himself and everyone else present,  Wilson thinks POTUS will do the same, at the very least to the Republicans.

DB_Article

See the full article here.

Here is synopsis from Newsweek.

Trump is a suicide bomber, and you’ve strapped yourselves to him so tightly that when he explodes, you’re going out to meet the 72 porn stars of the Trumpian afterlife with him. (Spoiler alert: They all look like Ivanka.)

“Trump’s manic performance Wednesday was distressing to watch, even for his supporters. Far from being the master of transgressive politics, his anger and frustration are evident and ugly. He’s lost control of the story and of himself.

“Trump can’t keep the process running on his terms and his timetable, and it’s driving him deeper into what I call the Eccentric Dictator Phase of his Presidency.” — Newsweek


Seat Belts_Mar24

Posted in Trade War, Uncategorized | Tagged , | 1 Comment

Wealth Distribution In America

In keeping the commitment we made to our readers in the post, America’s Perilous Path Of Wealth Distribution,  we follow up with some additional and interesting data on wealth distribution in the United States.    If you haven’t read Sunday’s post, run don’t walk to gather some background for the following data.  See here.

Here’s the summary section,

Summary

  • We illustrate the stark contrast in the growth of household wealth between the different percentile groups since Q1 2000
  • The top 1% of households now hold more wealth than the bottom 90%
  • The aggregate nominal wealth of the bottom 50% of households has fallen by almost 10 percent since 2000, from 3.4 percent of total household wealth to just 1.3 percent
  • The share of the top 1% is now over 31 percent and has grown by over 165 percent since Q1 2000
  • The average wealth per household of the bottom 50% has declined 25 percent in nominal terms and 50 percent in real purchasing power compared to the 1%’s increase of 118 percent and 50 percent, respectively
  • The widening wealth gap is a major factor in the rise of populism in the U.S. and the debate over a wealth tax will be a central focus of the 2020 presidential election
  • Asset inflation resulting from quantitative easing (QE) has contributed to the widening wealth gap

The following tables illustrate and present the aggregate wealth data from the Fed’s new Distributional Financial Accounts (DFA).  Note we use the terms “wealth” and “net worth” interchangeably.

Wealth Distribution By Percentile


Wealth_Table_1

This table was in our original post.

Key Takeaways

  • Top 1% now hold more wealth than the bottom 90%
  • Top 10% hold over 70% of U.S. household wealth
  • Bottom 50% experienced a decline in aggregate wealth
  • Bottom 50% hold a mere 1.3 percent of household wealth


Wealth Distribution By Growth Rates By Percentile Group

Wealth_T_Oct_1

Key Takeaways

  • Bottom 50% of households experienced an 8.6 percent decline
  • 90-99% percentile group experienced the most rapid growth
  • Household wealth expanded faster than nominal GDP by a factor of 1.3x
  • Asset markets experienced two ugly bear markets during the period yet growth aggregate wealth and nominal GDP still diverged, which is not sustainable


Wealth Distribution As A Percent Of GDP  Growth By Percentile Group


Wealth_T_Oct_5

Key Takeaways

  • Household wealth expanded to 486 percent of GDP by Q1 2019, which is historical, if not, the historical high.
  • Bottom 50% of households saw their wealth fall from 14 percent of GDP to 6.1 percent
  • 50-90% of percentile group household kept just kept pace with GDP growth


Distribution Of Wealth Gains By Percentile Group

Wealth_T_Oct_3

Key Takeaways

  • Total U.S. household wealth increased by $60.6 trillion from Q1 2000 to Q1 2019
  • Bottom 50% transferred a small portion of their wealth to the up 50%
  • 10% of households took down almost 75 percent of wealth gains
  • 90-99% percentile group, with wealth per household ranging from $1.5 million to $11 million, took the largest portion of gains, or 41.8 percent of the $60.6 trillion increase in total wealth.

Note the data are not drawn from a panel study, which is a particular design of data where each unit of analysis is followed at specified intervals over a long period.  That is many of the households in each percentile moved into other percentiles over the period.

Upshot

Long pitchforks.

Stay tuned for a couple more posts on Wealth Distribution in America.

Running Out Of Free Lunches

We are almost out of free lunches, folks, and will be posting only sporadically unless your support increases.   Donate whatever you think is fair by clicking on the PayPal button just below the Twitter and search icons on the upper right-hand side of the blog.  You do not need a PayPal account and can use almost any credit card.

Don’t be a free rider.  Thanks, so much.

free rider

Posted in Economics, Uncategorized | Tagged | 6 Comments