Jobs Market Weaker/Risks Higher Than Perceived

Last month we noted the divergence of nonfarm payrolls (NFP) and the employment data illustrated in the updated table below, which drove our skepticism about the labor market and overall strength of the economy at the same time many were breaking out the pom-poms.

Last Friday’s payroll data blew out expectations with a monthly gain of 263 new jobs yet employment fell again by 103k, the third decline over the past four months.  This is the first time in our database, which begins in 1990, that a positive monthly payroll number had an opposite sign of the employment data in three of four consecutive months.

That should make all of us sit up and listen.  – GMM, May 7th


Employment_Table


May Report – Two of Past Four Months < 100K Jobs Created

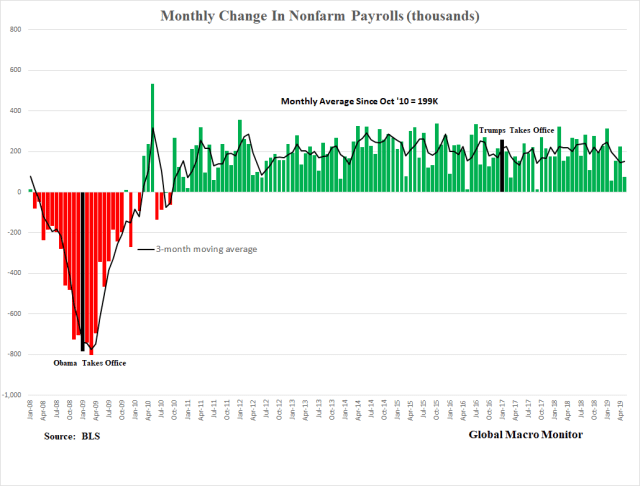
Fast forward one month, the BLS reported a big miss on Friday in nonfarm payrolls, including downward revisions of prior months. The employment data and NFP are beginning to move together again, at least for the month, however.

Dig Deep Folks

Digging deeper into Friday’s data we found that the 3-month moving average of the change in nonfarm payrolls is now in its lower quintile, 17th percentile, since October 2010, when the streak of 105-consecutive months of positive NFP prints began. Moreover, NFP has come in less than 100K in two of the past four months.   That has not happened since the summer of 2012, which ushered in QE3 the following fall.

…Growth in employment has been slow, and the unemployment rate remains elevated.

To support a stronger economic recovery and to help ensure that inflation, over time, is at the rate most consistent with its dual mandate, the Committee agreed today to increase policy accommodation by purchasing additional agency mortgage-backed securities at a pace of $40 billion per month…These actions, which together will increase the Committee’s holdings of longer-term securities by about $85 billion each month through the end of the year, should put downward pressure on longer-term interest rates, support mortgage markets, and help to make broader financial conditions more accommodative. FOMC, September 13, 2012

Note the unemployment rate in August 2012 was 8.1 percent compared to 3.6 percent reported last Friday.   We have many problems with how the unemployment rate is constructed (see here) but it is nonetheless stunning to talk about a new round of monetary easing with 3.6 percent unemployment.

I see the ghost of a dead king, folks.  Something is rotten in the state of Denmark. 


NonFarm_Chart

Financial Conditions

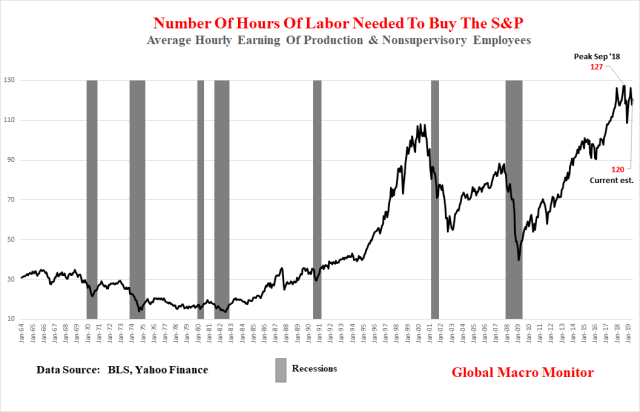
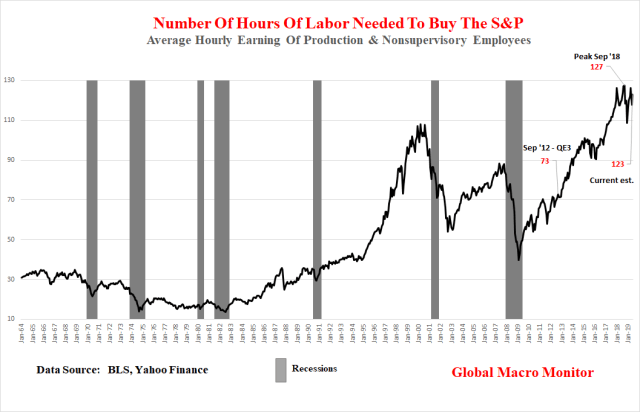
During the fall of 2012, the Chicago Fed National Financial Conditions Index was at around -0.40 compared to -0.83 today.   In addition, the valuation of the S&P500, as we measured it last week in terms of work hours needed to buy the index, is now 69 percent more expensive than it was back September 2012.

That’s not just a higher level of the S&P, folks, it is a higher macro valuation —  the index level deflated by a measure of economic activity, average hourly earnings.  In other words,  the S&P500 has outpaced the average hourly wage of producing Americans by 69 percent since the summer of 2012.  Enter the populists.

Misplaced Market Focus

We believe markets are too focused on the level of interest rates in terms of the Fed’s potential firepower to fend off the next recession and take a bit more comfort that  policy rates are 200 bps plus above zero.   Not so fast.

IMF_Monetary Transmission

Monetary Easing With Extreme Asset Valuations

Asset inflation, not credit expansion, is now, at least as we perceive, the main transmission mechanism of monetary policy, which drives aggregate demand through the unleashing of animal spirits and the wealth effect.  If the Fed embarks on a path of monetary easing with the initial conditions of extreme asset valuations, as we have measured them, that makes us extremely nervous.

Number Hours_2

Some households in our bifurcated economy are in decent shape, not that levered, and have room to borrow to drive consumption on the margin but we suspect not that many. And those who can have a lower marginal propensity to consume than those who can’t.

This is not to say the S&P500 won’t continue to rally on monetary easing.  The market is pricing an 86 percent probability of at least two rate cuts by January 2020 and a 21 percent probability of four or more cuts and the S&P has already rallied 5.8 percent from last Monday’s low which was one nasty bear trap.

It is our view, the next easing will likely be a watershed event where markets begin to lose their already misguided overconfidence in the efficacy of central banks.  The bubble to end all bubbles.

Almost everyone is too focused on interest rates and not asset valuations as the initial conditions when a new round of monetary priming begins.

We suspect the market will start to worry and soon begin to internalize our above analysis not too far into the next round of easing and come back down to earth, slammed by a Big Dipper correction, sell-off, bear market, or whatever you wish to call it.

Do realize the Big Dipper is

a large asterism consisting of seven bright stars of the constellation Ursa Major – Wikipedia

Ursa Major.  Sounds about right.

Ursa_Major


Get Shorty

We will continue to be looking to reduce risk exposure and scanning for short opportunities as the markets lather themselves up with the coming or expected liquidity served up at the Last Chance Saloon.

One Big Caveat

As always, we reserve to right to be wrong.

Though we like being right and making money, we are often wrong and understand nobody knows the future. We analyze and write also to discipline our thoughts, stress test conventional wisdom, and help our readers to see an alternative perspective to the perma-cheerleading that dominates financial media.

Moreover, we also recognize the probabilities are rarely on the side of the bears.  Since 1921, for example, the Dow has generated a positive annual return almost 70  percent of the years.  In only 12 of those 98 years, the Dow has experienced back-to-back negative years.

Furthermore, even if all our facts are correct, our conclusions may be completely wrong.  Then there is the big problem of getting the timing right.   This is not an easy business, folks.

Lawyer Abe Lincoln

To illustrate this, we like to use the story that Abraham Lincoln used to tell to try and persuade juries when he was an Illinois circuit court lawyer.

The story goes that Lawyer Lincoln was worried he had not convinced the jury during the closing argument of a civil case against a railroad.   The jurors had gone to lunch to deliberate.  Lincoln followed them and interrupted their dessert with a story about a farmer’s son gripped by panic,

“Pa, Pa, the hired man and sis are in the hay mow and she’s lifting up her skirt and he’s letting down his pants and they’re afixin’ to pee on the hay.” “Son, you got your facts absolutely right, but you’re drawing the wrong conclusion.”

The jury ruled in Lincoln’s favor.

Posted in Uncategorized | Leave a comment

All Things Macro

This is good stuff, folks.  Joe, who is a friend, easily makes it into our elite “one smart dude” club.   Click on the video.  It’s well worth your time and will make you smarter.

Posted in Uncategorized | Leave a comment

Pick Your POTUS


Posted in Uncategorized | Leave a comment

Eternal Gratitude For The Greatest Generation

Soldiers, Sailors and Airmen of the Allied Expeditionary Force: You are about to embark upon the Great Crusade, toward which we have striven these many months. The eyes of the world are upon you. The hope and prayers of liberty-loving people everywhere march with you.

Your task will not be an easy one. Your enemy is well trained, well equipped and battle-hardened. He will fight savagely.

But this is the year 1944! The tide has turned! The freemen of the world are marching together to victory!

I have full confidence in your courage, devotion to duty and skill in battle.

We will accept nothing less than full victory!

Good luck! And let us all beseech the blessing of Almighty God upon this great and noble undertaking.

—Gen. Dwight D. Eisenhower, Supreme Allied Commander, 6 June 1944.

D-Day


Posted in Uncategorized | Leave a comment

No Worries…The Fed Has This One

https://twitter.com/anilvohra69/status/1136218167317938176?s=21

Posted in Uncategorized | Leave a comment

How Many Hours Of Work Does It Take To Buy The S&P500?

How expensive is the S&P?   Loaded question but thanks for asking.

Macro Metrics

Here at the Global Macro Monitor, we lean toward macro metrics to get a sense of the historical valuation of the stock market and heavily discount — no, entirely dismiss — the “this time is different”  nonsense to justify an expensive market.    Macro metrics do not allow the divorce of market valuation from the economic fundamentals.

Because stocks like to go up and have risen and generated a positive return in 67 of the past 98 years since 1921, it behooves long-term investors to rarely touch their investment portfolio and go to cash or become overly defensive.

Dow_Box_DigitsHowever, there are a few times in an investor’s life when an extraordinary large cash position is warranted.  We believe this is one of those times.

Anybody who believes a rules-based multilateral order, our globalised economy, or even harmonious international relations, are likely to survive this conflict [U.S. v. China] is deluded. – Martin Wolf, FT

Setting aside our serious concerns about the secular shift in the global geopolitical and economic tectonic plates coupled with ugly U.S. domestic politicswhich will have very negative consequences for stocks, in our opinion, let us focus just on market valuation in the post.

Domestic Politics

Hours Of Work Needed To Buy S&P

One valuation metric we like, which often flies under the radar,  is the number of hours of work needed to purchase the S&P.   We deflated the monthly S&P500 time series by the average hourly earnings of production and nonsupervisory employees and found the S&P500 is currently at a level of extreme valuation.

Stocks eventually have to track the economy but do often diverge for periods longer than most short-sellers can remain solvent.   We respect that and tend not to fight the market until it shows signs of cracking.  Easier said than done, however, as the algos have mastered the art of setting bear traps.  Monday was a case in point.  They are not fun.

And, yes, we get it, the average Jane Doe who earns the average hourly earning doesn’t buy stocks but a large portion of the economy is made up of average Jane.

Politics

Moreover, if you need an illustration to quickly sum up the current political conflict in the U.S.,  go no further than the following chart.   The data shows the obvious: the return on capital has rapidly outpaced the return to labor since 1990, which is another factor contributing to the Summer of Discontent.

Profits don’t grow to the sky and are subject to economic constraints.  Squeezing labor costs to further increase margins creates not only political conflict but tips the economy into a nasty feedback loop of weak demand, lower capital spending, and more cowbell buybacks.  The end result is punk economic and top-line growth further forcing firms to increase margins by additional cost-cutting.  Wash, rinse, repeat.

Hours Needed To Buy S&amp;P

The Buffet Indicator

We also like the “Buffet Indicator” — market capitalization-to-GDP —  tracked by Doug Short at Advisor Perspectives.

Market Cap to GDP is a long-term valuation indicator that has become popular in recent years, thanks to Warren Buffett. Back in 2001, he remarked in a Fortune Magazine interview that “it is probably the best single measure of where valuations stand at any given moment.”  – Doug Short

This macro metric also illustrates stock valuations are at historical extremes.

Buffet Indicator_Short.png

Upshot

The stock market is at a historical extreme valuation measured by the above two macro metrics.  Nevertheless, stock traders are super lathered up and have taken the Dow up over 700 points in the past two days on the belief the Fed will, once again, ride to the rescue.

We don’t know how much higher stocks can go on the Fed crack but have learned not to fight it.

We do know, however, secular and structural forces are beginning to converge on the economy and market, such as the ugly geo- and domestic politics, too much public, and corporate debt, and shrinking global trade, just to name a few.  These problems need to be addressed through structural reform, compromise, and cooperation and cannot be fixed with simple cyclical monetary policies, such as interest rate cuts and more quantitative easing (QE).

Valuations must come way down for a new round of QE to have any hope of moving the economic needle.  If the Fed begins easing monetary policy in the next few months as markets have priced — > 70 percent probability of July rate cut — it will do so with the lowest starting policy rates and, unless markets crash in the next few weeks, the highest starting asset values in its history.   The central bank will have very few moves before it finds itself in checkmate, in our opinion.

When will traders and investors internalize this?  You decide.

Posted in Uncategorized | 20 Comments

America’s Path To A FIRE Economy

We originally posted this chart in February 2011, which we just updated also breaking out the real estate industry from FIRE (finance, insurance, and real estate).   It is still just as shocking as it was back when we first produced it.

Economy Jumps The Shark

The U.S. economy jumped the shark in 1990 when FIRE overtook the manufacturing sector in terms of its contribution to GDP.   More stunning is that real estate is now the largest industry sector of the U.S. economy in terms of value added output, now surpassing manufacturing by 0.8 percent of GDP.

An Economy Of Flippers

Who would have thought in 1947 that output of the country’s manufacturing sector would decline from one-quarter of the gross domestic product to close to 11 percent and would be surpassed by the output of a bunch of real estate agents and house flippers?  Nothing against real estate agents, by the way, and Flipper was my favorite television show as a kid.

Real estate is now the largest industry as a percentage of GDP.

Greater Sensitivity To Interest Rates And More Leverage

No wonder why the economy and markets are so addicted to and can’t live without low-interest rates.  The danger is, however, the real estate sector is a highly leveraged industry.  Real estate deflation the one the Fed fears most.

FIRE_Economy


Value_Added_GDP


Appendix

Classifications

See BEA classification guide here

Posted in Uncategorized | 16 Comments

Chair Powell Courts Goldilocks

Posted in Uncategorized | Leave a comment

S&P500 Key Levels

Summary 

  • The selling continues as markets fret about the Trump administration’s tariff wrecking ball
  • The S&P closed below its 200-day moving for the second straight day,  the first time since early March
  • 2722 is the key Fibo level to watch, which is above today’s low of 2728.81
  • The S&P remains around 12 percent above the hairy, scary level of 2400ish that puts the secular bull into play
  • Markets are giving up hope on a China trade deal and now looking to the Fed for another rescue
  • The market still has considerable more downside, in our opinion
  • Of course, not in a straight line

The ugly May for stocks has come and gone and the selling continues.  This is all about trade worries and the market is beginning to contemplate, though hardly priced, what we have been posting for quite a while, the geopolitical and economic framework, which has driven stocks since 1982 may be on the brink.

Markets have been so invested in the ideas of globalisation, free-flowing capital, and “convergence” – the idea that the “world is flat” (as Thomas Friedman once put it) – that they can’t bear to do the work involved in changing their minds.

Note also that many in the financial industry are heavily dependent on the “buy and hold forever” model. So the message to clients is “don’t worry, markets always go up in the long run, this is just a storm in a teacup”. That encourages the creation of arguments to support the status quo, even as it is increasingly challenged.

This is why investors would rather believe that Trump is a player of 3D chess – a master strategist and negotiator, bringing his business experience into the rarefied, stuffy halls of government.  – MoneyWeek

Even after the 7.63 percent sell-off from the May 1st high to today’s low,  the January to May rally has only retraced about one-third of its gains and has yet to violate the key .618 Fibo at 2722.05.  The S&P closed below its 200-day for the second straight day, which hasn’t happened since March 8th.

Also note, the S&P is still about 12 percent of the huge level of 2400-ish, where things get very hairy and scary.   We do think that is where the market is headed albeit not in a straight line and not without the Fed trying to rescue the market.

Key ST Levels

To the upside, the 200-day at 2775.02 and the 2781.99, the first Fib retracement level of the current sell-off.   The big downside level is today’s low at 2728.81 and the Key Fibo of the January-May rally at 2722.05.

Gun to head, unless a positive trade tweet with some beyond meat, a few days of chop before the 2722.05 is taken out.  This said with the caveat that short-term moves are noise and a mug’s game trying to predict them.

S&amp;P

S&amp;P_Daily

S&amp;P_Weekly

Posted in Uncategorized | 1 Comment

GMM At The Movies: Rocketman

Posted in Movies, Uncategorized | Tagged , | Leave a comment