
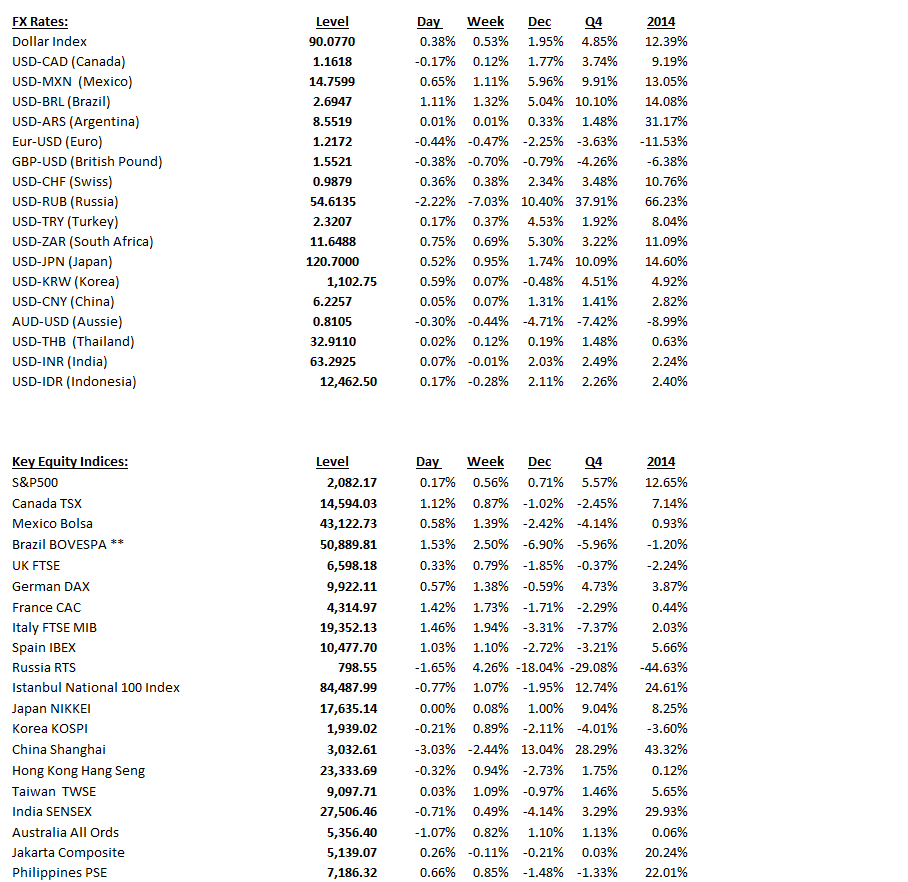
Click on table to enlarge and for better resolution
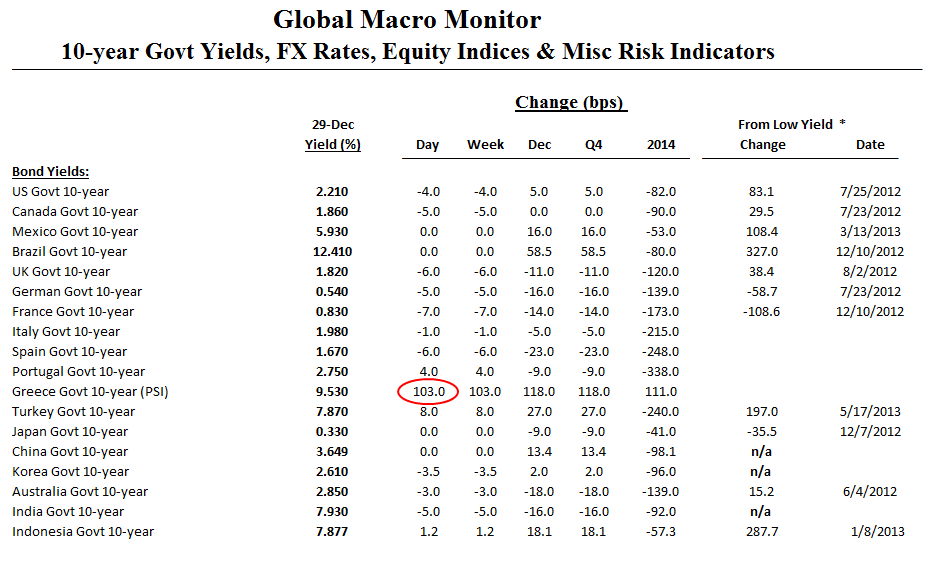

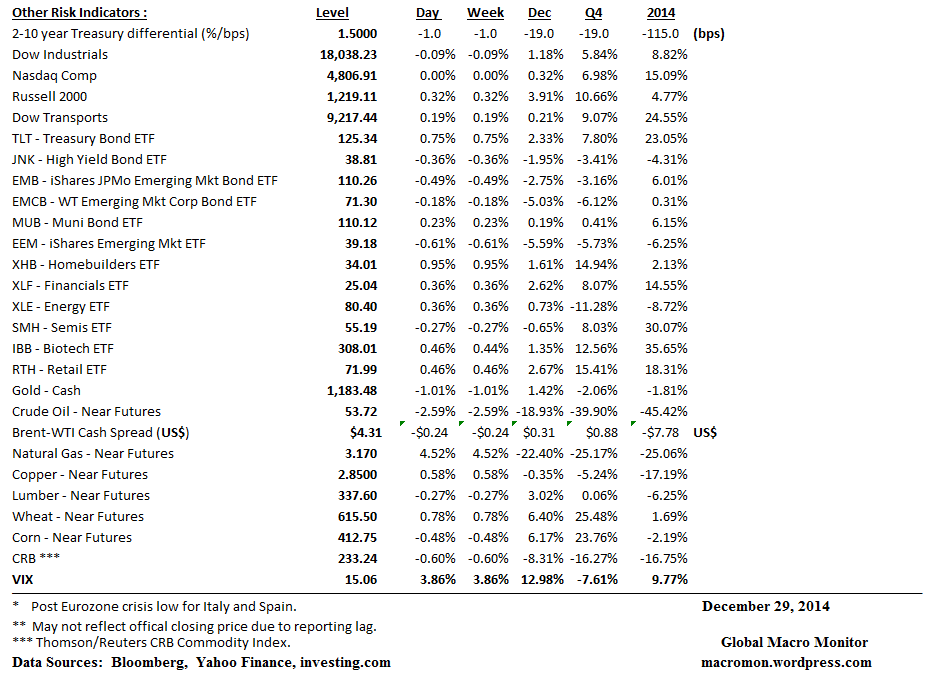 (click here if table is not observable)
Click on table to enlarge and for better resolution
(click here if table is not observable)
Investors this year have been keen on the US but have given up on Europe. Markit analyst Simon Colvin explains to capital markets editor Ralph Atkins that despite this, delving into more granular ETF flows, investors were less risk averse, clamouring for Spain, Russia and Italy.
For more video content from the Financial Times, visit http://www.FT.com/video
(click here if video is not observable)
 (click here if chart is not observable)
 (click here if charts are not observable)
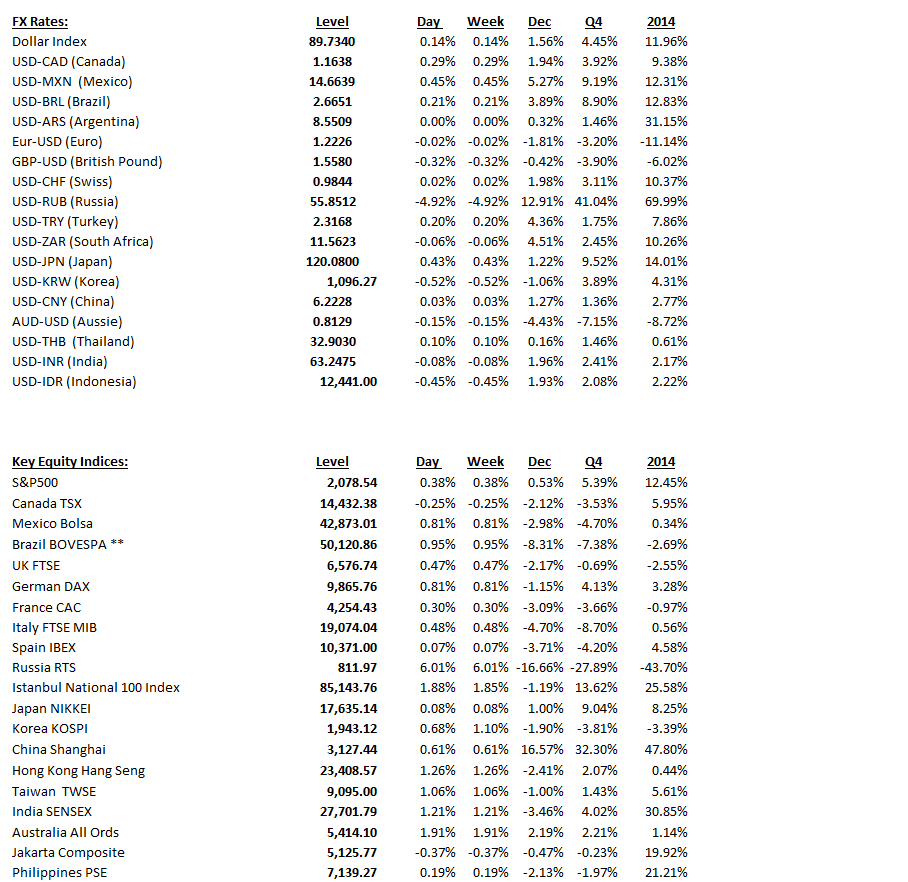
Click on table to enlarge and for better resolution

 (click here if table is not observable)
The S&P 500 has set a new all-time closing high, completing a turnaround from its 5 per cent fall earlier this month. John Authers talks to Tony Werley of JPMorgan Asset Management about predictions for the next ten years – which can often be easier than predicting the next few weeks.
Click here for more Authers Note videos
http://video.ft.com/Authers-Note
(click here if video is not observable)
 (click here if charts are not observable)
Click on table to enlarge and for better resolution

 (click here if table is not observable)
The Russell 2000, this year’s laggard up 3.28 percent vs. the S&P500’s 12.45 percent, has triggered a cup with handle breakout (or, depending on your perspective, an inverse head and shoulder). The next level watch is its all-time high at 1213.55. The Russell divergence has been a major argument used by the bear camp as they fight this incredible bull market. Stay tuned.  (click here if chart is not observable)
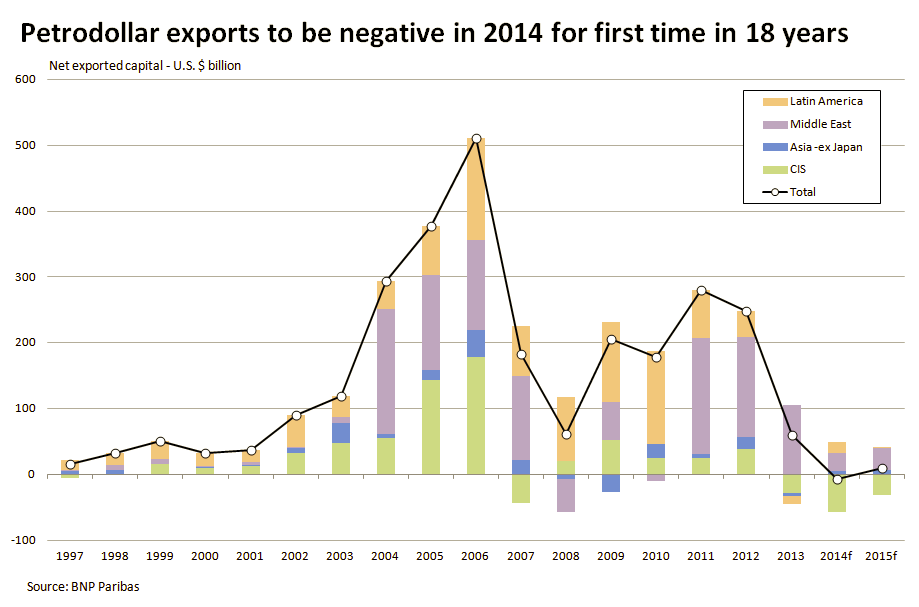
Last week we pointed out that the crash in oil prices will reduce global liquidity as the revenue of oil exporters falls dramatically.
This raises an interesting question: as petrodollars come out and flows to financial markets are reduced, shrinking the pool of global liquidity, and as the real income of oil consumers increase, will the net result be marginally weaker financial markets and stronger global economic growth?
These countries recycle their oil earnings back into the global financial markets, including the purchase of U.S. Treasury securities. The oil exporters, including Russia and Norway, are the third largest foreign holders of Treasury securities, behind China and Japan.
BNP Paribas reports that this year the flow of petrodollars from energy-exporting countries into world markets will, for for the first time in almost 20 years, turn negative.
The chart below illustrates this, showing petrodollar capital flows peaked in 2006, which contributed to Alan Greenspan’s bond market conundrum and the Fed’s inability to affect long-term interest rates. The forrmer Fed chairman attributes capital inflows as one of major factors causing the credit and housing bubble.
Stay tuned.
 (click here if chart is not observable)

