
Click on table to enlarge and for better resolution


(click here if table is not observable)
The revision to U.S. Q3 GDP growth came in better than expected. The BEA reported this morning,
Real gross domestic product — the value of the production of goods and services in the United States, adjusted for price changes — increased at an annual rate of 3.9 percent in the third quarter of 2014, according to the “second” estimate released by the Bureau of Economic Analysis. In the second quarter, real GDP increased 4.6 percent.
The GDP estimate released today is based on more complete source data than were available for the “advance” estimate issued last month. In the advance estimate, the increase in real GDP was 3.5 percent. With the second estimate for the third quarter, private inventory investment decreased less than previously estimated, and both personal consumption expenditures (PCE) and nonresidential fixed investment increased more. In contrast, exports increased less than previously estimated (see “Revisions” on page 3).
The increase in real GDP in the third quarter reflected positive contributions from PCE, nonresidential fixed investment, federal government spending, exports, residential fixed investment, and state and local government spending that were partly offset by a negative contribution from private inventory investment. Imports, which are a subtraction in the calculation of GDP, decreased.
The deceleration in the percent change in real GDP reflected a downturn in private inventory investment and decelerations in exports, in nonresidential fixed investment, in state and local government spending, in PCE, and in residential fixed investment that were partly offset by a downturn in imports and an upturn in federal government spending.
The price index for gross domestic purchases, which measures prices paid by U.S. residents, increased 1.4 percent in the third quarter, 0.1 percentage point more than in the advance estimate; this index increased 2.0 percent in the second quarter. Excluding food and energy prices, the price index for gross domestic purchases increased 1.6 percent in the third quarter, compared with an increase of 1.7 percent in the second.
John Authers reports from New York on the remarkable rise of the US stock market. Traders are betting that the US economy will roar ahead, even as the rest of the world stays in the doldrums. Can they be right?
For more video content from the Financial Times, visit http://www.FT.com/video
(click here if video is not observable)


(click here if charts are not observable)
Markit reported its flash PMI for the U.S. service sector this morning, coming in at 56.3 and softer than the expectation of 57.3,
The seasonally adjusted Markit Flash U.S. Services PMI™ Business Activity Index – which is based on approximately 85% of usual monthly replies – registered 56.3 in November, down from 57.1 in the previous month and the lowest reading since April. Moreover, the index has now pointed to softer growth of business activity in each of the past five months, to signal a sustained loss of momentum since the post – crisis peak seen in June…
Commenting on the flash PMI data, Chris Williamson, chief economist at Markit said:
“A fifth-consecutive monthly slowing in growth in the service sector adds to signs that the economic upturn has lost considerable momentum, though it’s important to note that the pace of expansion remains robust by historical standards“
After the manufacturing PMI showed factory output growth slowing in November to the lowest since January, the weaker pace of service sector expansion puts the economy on course to grow at a 2.5% annualised rate at best in the fourth quarter.
With extreme weather hitting parts of the country, growth could slow even further.“However, growth has merely eased from very strong rates earlier in the year. Importantly, even the slower rate of growth signalled by the PMI surveys remains sufficiently strong to generate robust numbers of new jobs. Firms took on staff at
a rate consistent with another increase in payroll numbers of roughly 200,000 in November.“The worry is that any hiring intentions could rapidly deteriorate if firms’ order book inflows fail to pick up again soon.”
The Ifo Business Climate Index for industry and trade in Germany rose in November to 104.7 points from 103.2 points in October. The business climate previously deteriorated six times in a row. Assessments of the current business situation are slightly more favourable than last month. Expectations with regard to the months ahead are also brighter. The downturn in the German economy has ground to a halt for the moment at least.

(click here if chart is not observable)
Speaker: Jason Furman
Chair: Professor John Van ReenenRecorded on 5 November 2014.
Jason Furman’s talk will focus on the three major structural opportunities that he sees in the US economy: the slowdown in health costs; the boom in energy; and recent developments in technology. These issues have the potential to change long-term economic trends and structures. He will discuss the prospects they hold for the economy, the challenges they present, and the role of public policy in fostering them.
Jason Furman (@CEAChair) is the Chairman of the Council of Economic Advisers. Prior to this role, he served as the Principal Deputy Director of the National Economic Council. Furman has also previously served as Economic Policy Director for Obama for America, Director of the Hamilton Project at the Brookings Institution, and Special Assistant to the President for Economic Policy during the Clinton Administration. He has conducted research in a wide range of areas, including fiscal policy, tax policy, health economics, Social Security, and monetary policy. Furman earned his Ph.D. in Economics and a M.A. in Government from Harvard University and a M.Sc. in Economics from LSE.
John Van Reenen is the Director of CEP.
The Centre for Economic Performance (@CEP_LSE) is an interdisciplinary research centre at the LSE Research Laboratory. It was established by the Economic and Social Research Council (ESRC) in 1990 and is now one of the leading economic research groups in Europe.
(click here if video is not observable)
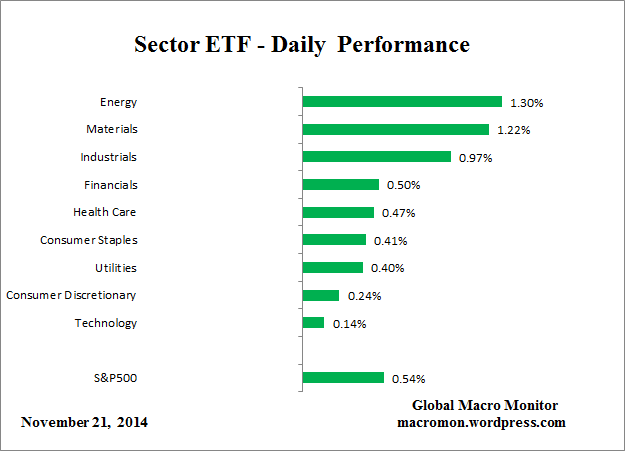


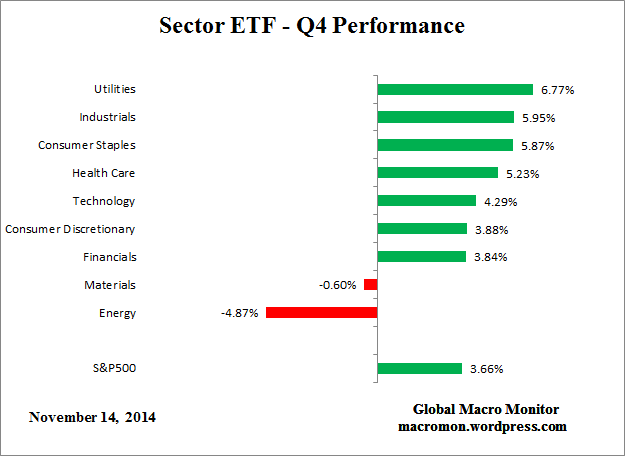
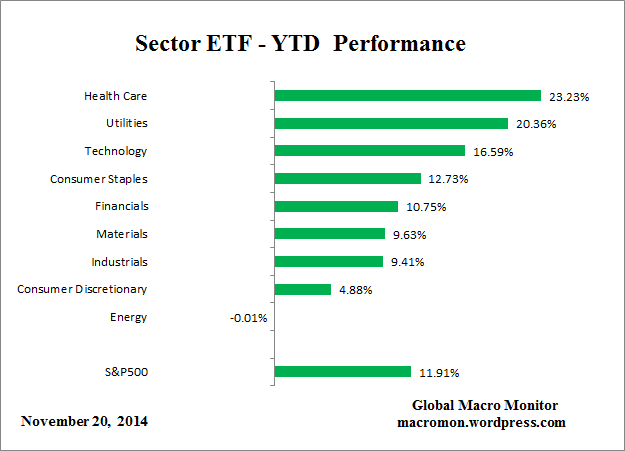
(click here if charts are not observable)



