
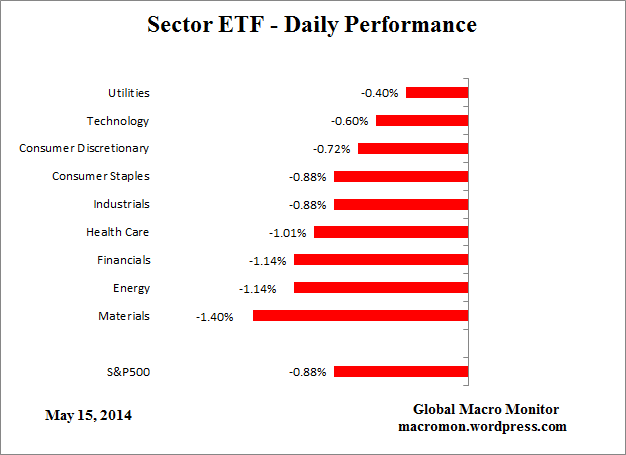
Click on table to enlarge and for better resolution


 (click here if table is not observable)
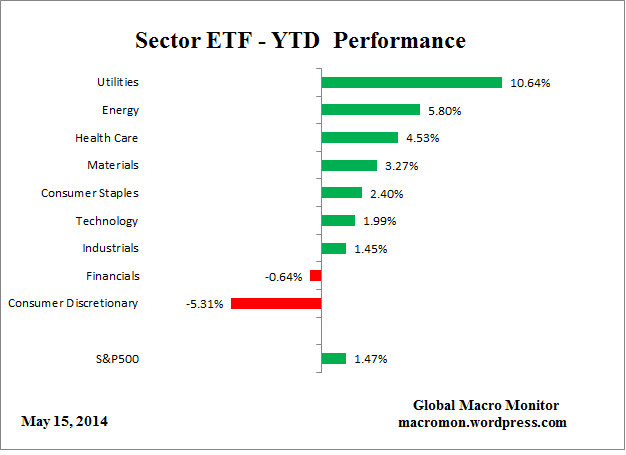
Click on table to enlarge and for better resolution
(click here if table is not observable)
Peter Spiegel, the Financial Times’s Brussels bureau chief, recounts the moments in 2011 and 2012 when the euro came closest to collapse, and how politicians and bureaucrats battled over the solutions that eventually saved the euro.
For more video content from the Financial Times, visit http://www.FT.com/video
(click here if video is not observable)
The whipsaw action in the markets continue. It’s tough to navigate through all the noise so let’s go to the charts of the major indices.
Dow Jones Industrials
Note the 50-day moving average, currently at 16,401, has provided key support for the Dow. It traded a couple points below there today and bounced. Watch the 50-day.
 S&P500
Similar to the Dow, the 50-day, currently at 1,868 is providing key support for the S&P500. The index traded 6 points through that level today, but manged to close a couple points above. The S&P500 remains range bound, with 1820-ish on the downside and 1900 on the upside. A close below the 50-day may presage a move to the lower end of the range.
 Nasdaq
The Nasdaq is carving out a potential Head & Shoulders reversal pattern, which will trigger around the 200-day moving average at 4,000. Watch the 4,000 level.
 Russell 2000
The Russell is down 5.81 percent year-t0-day, almost double the loss the in the Nasdaq. It did put in a stronger bounce than the other indices today but still sits at a precarious level. Note 1080 is the level to watch. The index traded bounced off its low of 1082.53 today.
 (click here if charts are not observable)
 (click here if charts are not observable)
Click on table to enlarge and for better resolution


 (click here if table is not observable)
Disappointing action after yesterday failed breakout in the S&P500. It’s tough out there but the one trade that seems to be working this year is betting on gap fills in the S&P500. Note, today the market thought about filling Monday morning’s opening gap up in the SPY but ran out of time as shorts had cover into the close.
Does the SPY gap down at tomorrow’s open and then spend the rest of the day filling the opening gap? Stay tuned.
 (click here if chart is not observable)

 (click here if charts are not observable)
Click on table to enlarge and for better resolution


 (click here if table is not observable)


